
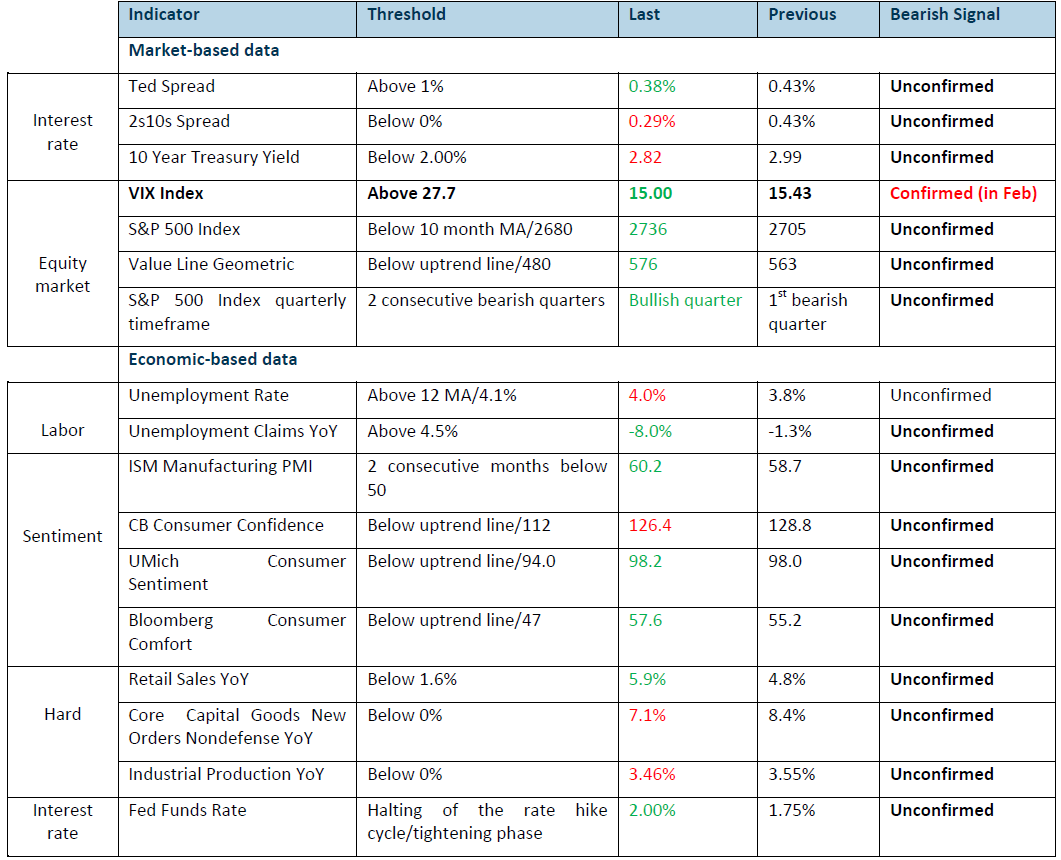
Our Phillip recession tracker is based on 15 market-based and economic-based indicators. The threshold represents the levels where bearish signal arises.
Red/Green represents deterioration/improvement from the prior month. Otherwise, it is unchanged.For more information on how we decipher the recession tracker indicators, refer to the report
All clear for now
All clear for now part 2
Overall, the performance from the 1H 2018 appears decent except for the Dow Jones Industrial Average (DJIA) as the trade tensions are hurting the export-driven components in the DJIA. Nonetheless, our outlook for 2H 2018 remains upbeat as our “Recession Tracker” continues to signal strong growth ahead despite the ongoing trade war scare. The near-term catalyst that is currently plaguing the market is the trade tension and the strong dollar move for the past four months. Some other key highlights for June is the monetary policy action from the Federal Reserve and European Central Bank.
US-China trade tension
Once again, the trade war scare between US and China had returned to haunt the market just when the trade tensions subsided in May. In May, there seemed to be a resolution and de-escalation of the trade war after the joint summit statement stated a consensus was stuck between US and China to take effective measures to substantially reduce the US trade deficits in goods with China.
However, the trade tension heated up again in June after the US administration announced that a 25% tariff would be imposed on $50 billion China imports that involve significant technologies. China also responded immediately with a similar 25% tariff on $50 billion US goods.
At the height of the dispute, US raised the stakes by stating a possibility of restricting foreign investment into the US, mainly targeted at China.
All in, as a result, June turned out to be a sluggish month plagued by the escalation of the trade war. DJIA was hit the hardest as it fell -5% from the June’s high followed by the Nasdaq 100 index and S&P 500 index with -4.3% and -2.73% respectively from the June’s high.
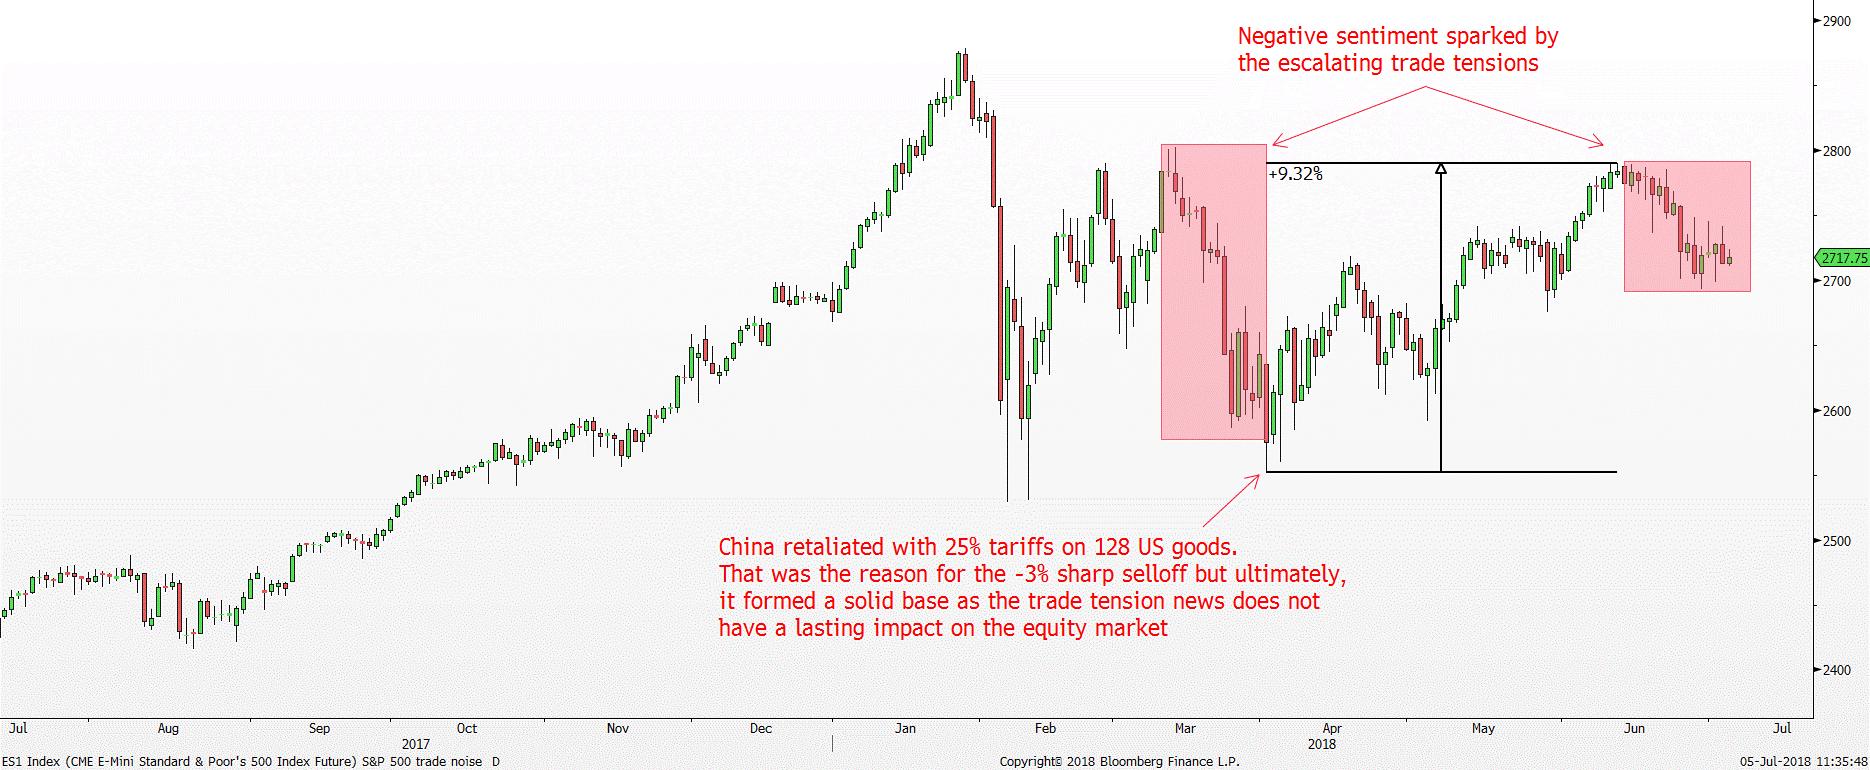
Nonetheless, even with this selloff, we do not expect the downtrend to sustain. Historically, the negative news flow tends to fade away in due course, and the negative sentiment would eventually reverse. For example, in April 2018 when the trade war tension between US and China was at a high, the S&P 500 index also suffered 2-3 months of negative sentiment before reversing the negativity. It was the news of China retaliating with 25% tariffs on 128 US goods worth $3 billion a year that anchored in the Year to Date low in all three US equity indices. Buying the dip back then was a perfect strategy in hindsight.
Figure 1: Trade tension does not have a lasting negative impact on the equity market
Source: Bloomberg, PSR
Hence, despite the ongoing negative newsflow regarding the trade war, expect this negative sentiment to stay short-lived and expect the 200-day moving average in DJIA to hold up once again for the bulls to establish a floor.
FED hiked FFR to 2%
The Federal Reserve (Fed) stayed on the rate hike cycle trajectory as expected and raised the Fed Funds Rate (FFR) from 1.75% to 2.00% in the June FOMC meeting. The Fed also guided the market to the possibility of two more rate hikes this year.
With all four measures of inflation, CPI, Core CPI, PCE and Core PCE deflator being above the Fed’s target of 2%, there is a high likelihood of seeing two more 0.25% interest rate hikes this year. More importantly, the Fed’s preferred inflation gauge, Core PCE deflator has just risen to 2% for the first time since 2012 suggests inflation is firming. To be specific, the September and December FOMC meeting will be the most likely period when the Fed would lift the FFR. In other words, the FFR would be at 2.5% by the end of 2018.
We do not expect this rate hike to cause any significant negative tailwind to the equity market as the Fed has been guiding the market all along with this expectations. As long as the inflation data stays relatively tame around the 2% level, the Fed should act according to their forward guidance with gradual rate hikes.
However, if the inflation data spins out of control especially if the Core PCE YoY data exceeds the 2% level, somewhere north of 2.5% for two months or more, that could force the Fed to raise interest rates faster than expected. Under that scenario, the equity market could suffer negatively due to the inflation shock and tighter than expected monetary policy.
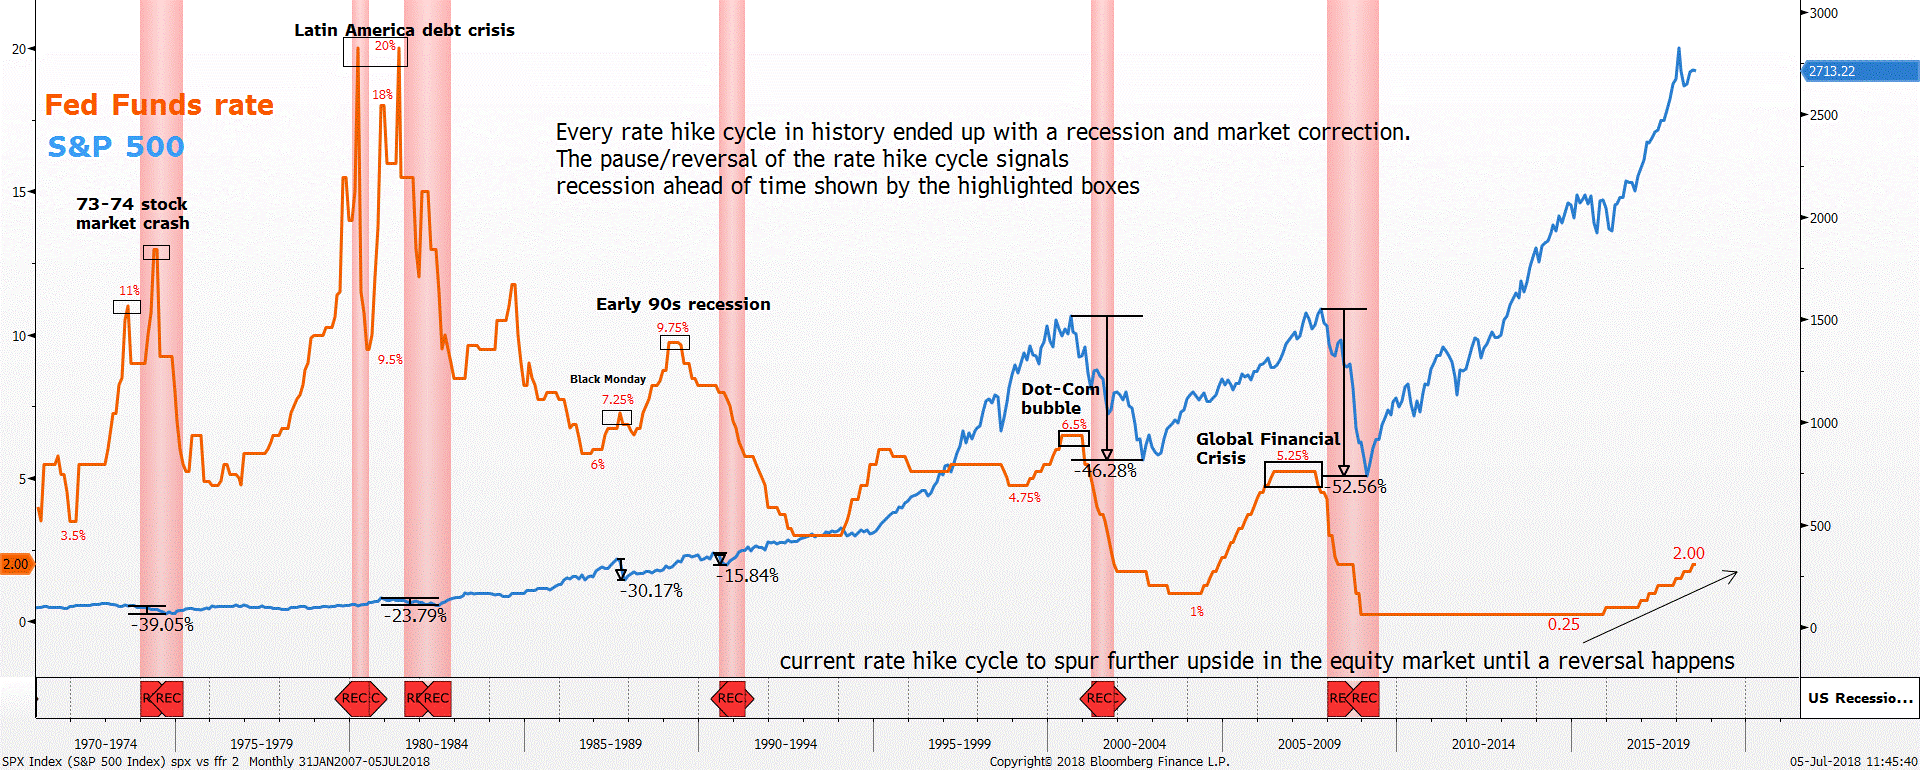
Based on our historical study between the implications of the Fed rate hike cycle and equity market, the end of the equity bull market is usually signalled by an abrupt change in the monetary policy action. The reversal of the interest rate hike cycle to a period of holding FFR flat at a certain level and ultimately, the start of the rate cut is when the equity market forms its respective crisis top and enters into a bear market.
Figure 2: Current rate hike cycle to spur further upside in the equity market
Source: Bloomberg, PSR
* Red vertical areas are the recessionary periods
Therefore, looking at the June’s FOMC projections, it seems likely that two more interest rate hike is on the table by the end of 2018 and three more interest rate hikes in 2019. All in, the rate hike trajectory seems like it is here to stay. As long as the Fed continues to hike the FFR gradually, the general equity market should continue to expand along with it.
The time to worry for a sharp reversal in the equity bull market is when the Fed suddenly switches to the dovish side and begin to cut interest rate.
The European Central Bank (ECB) kept interest rate unchanged at 0% while announcing their plan to taper the monthly asset purchase program
The ECB met the market’s expectation of keeping interest rate unchanged at 0% and the tapering timeline of the asset purchase program. The monthly asset purchase program will taper again from €30 billion to €15 billion from October through December 2018. After which, the net asset purchase program will end, and the ECB would only reinvest the principal amount of the maturing assets
However, the main piece of news that shocked the market was the forward guidance on the interest rate hike path. Prior to the ECB meeting in June, the market’s expectation for the start of the interest rate hike cycle is somewhere around June – July of 2019. However, the ECB undelivered and guided the market for a timeline of at least through summer 2019 before the interest rate is lifted. Put differently, the ECB would only begin their interest rate hike cycle earliest in June to September 2019 or later, dependent on the incoming economic data especially the inflation numbers.
Thus, expect the general equity market to remain supported in the near-term as the ECB remains highly accommodative and dovish.
US Dollar Strength
The Dollar Index (DXY) is one of the main causes of the general weakness within the global equity market especially the emerging markets. The DXY index rose 5% for the past three months, resulting in a bloodbath in the global equity market especially the emerging markets.
Important Information
This report is prepared and/or distributed by Phillip Securities Research Pte Ltd ("Phillip Securities Research"), which is a holder of a financial adviser’s licence under the Financial Advisers Act, Chapter 110 in Singapore.
By receiving or reading this report, you agree to be bound by the terms and limitations set out below. Any failure to comply with these terms and limitations may constitute a violation of law. This report has been provided to you for personal use only and shall not be reproduced, distributed or published by you in whole or in part, for any purpose. If you have received this report by mistake, please delete or destroy it, and notify the sender immediately.
The information and any analysis, forecasts, projections, expectations and opinions (collectively, the “Research”) contained in this report has been obtained from public sources which Phillip Securities Research believes to be reliable. However, Phillip Securities Research does not make any representation or warranty, express or implied that such information or Research is accurate, complete or appropriate or should be relied upon as such. Any such information or Research contained in this report is subject to change, and Phillip Securities Research shall not have any responsibility to maintain or update the information or Research made available or to supply any corrections, updates or releases in connection therewith.
Any opinions, forecasts, assumptions, estimates, valuations and prices contained in this report are as of the date indicated and are subject to change at any time without prior notice. Past performance of any product referred to in this report is not indicative of future results.
This report does not constitute, and should not be used as a substitute for, tax, legal or investment advice. This report should not be relied upon exclusively or as authoritative, without further being subject to the recipient’s own independent verification and exercise of judgment. The fact that this report has been made available constitutes neither a recommendation to enter into a particular transaction, nor a representation that any product described in this report is suitable or appropriate for the recipient. Recipients should be aware that many of the products, which may be described in this report involve significant risks and may not be suitable for all investors, and that any decision to enter into transactions involving such products should not be made, unless all such risks are understood and an independent determination has been made that such transactions would be appropriate. Any discussion of the risks contained herein with respect to any product should not be considered to be a disclosure of all risks or a complete discussion of such risks.
Nothing in this report shall be construed to be an offer or solicitation for the purchase or sale of any product. Any decision to purchase any product mentioned in this report should take into account existing public information, including any registered prospectus in respect of such product.
Phillip Securities Research, or persons associated with or connected to Phillip Securities Research, including but not limited to its officers, directors, employees or persons involved in the issuance of this report, may provide an array of financial services to a large number of corporations in Singapore and worldwide, including but not limited to commercial / investment banking activities (including sponsorship, financial advisory or underwriting activities), brokerage or securities trading activities. Phillip Securities Research, or persons associated with or connected to Phillip Securities Research, including but not limited to its officers, directors, employees or persons involved in the issuance of this report, may have participated in or invested in transactions with the issuer(s) of the securities mentioned in this report, and may have performed services for or solicited business from such issuers. Additionally, Phillip Securities Research, or persons associated with or connected to Phillip Securities Research, including but not limited to its officers, directors, employees or persons involved in the issuance of this report, may have provided advice or investment services to such companies and investments or related investments, as may be mentioned in this report.
Phillip Securities Research or persons associated with or connected to Phillip Securities Research, including but not limited to its officers, directors, employees or persons involved in the issuance of this report may, from time to time maintain a long or short position in securities referred to herein, or in related futures or options, purchase or sell, make a market in, or engage in any other transaction involving such securities, and earn brokerage or other compensation in respect of the foregoing. Investments will be denominated in various currencies including US dollars and Euro and thus will be subject to any fluctuation in exchange rates between US dollars and Euro or foreign currencies and the currency of your own jurisdiction. Such fluctuations may have an adverse effect on the value, price or income return of the investment.
To the extent permitted by law, Phillip Securities Research, or persons associated with or connected to Phillip Securities Research, including but not limited to its officers, directors, employees or persons involved in the issuance of this report, may at any time engage in any of the above activities as set out above or otherwise hold an interest, whether material or not, in respect of companies and investments or related investments, which may be mentioned in this report. Accordingly, information may be available to Phillip Securities Research, or persons associated with or connected to Phillip Securities Research, including but not limited to its officers, directors, employees or persons involved in the issuance of this report, which is not reflected in this report, and Phillip Securities Research, or persons associated with or connected to Phillip Securities Research, including but not limited to its officers, directors, employees or persons involved in the issuance of this report, may, to the extent permitted by law, have acted upon or used the information prior to or immediately following its publication. Phillip Securities Research, or persons associated with or connected to Phillip Securities Research, including but not limited its officers, directors, employees or persons involved in the issuance of this report, may have issued other material that is inconsistent with, or reach different conclusions from, the contents of this report.
The information, tools and material presented herein are not directed, intended for distribution to or use by, any person or entity in any jurisdiction or country where such distribution, publication, availability or use would be contrary to the applicable law or regulation or which would subject Phillip Securities Research to any registration or licensing or other requirement, or penalty for contravention of such requirements within such jurisdiction.
This report is intended for general circulation only and does not take into account the specific investment objectives, financial situation or particular needs of any particular person. The products mentioned in this report may not be suitable for all investors and a person receiving or reading this report should seek advice from a professional and financial adviser regarding the legal, business, financial, tax and other aspects including the suitability of such products, taking into account the specific investment objectives, financial situation or particular needs of that person, before making a commitment to invest in any of such products.
This report is not intended for distribution, publication to or use by any person in any jurisdiction outside of Singapore or any other jurisdiction as Phillip Securities Research may determine in its absolute discretion.
IMPORTANT DISCLOSURES FOR INCLUDED RESEARCH ANALYSES OR REPORTS OF FOREIGN RESEARCH HOUSE
Where the report contains research analyses or reports from a foreign research house, please note:

Jeremy specialises in Technical Analysis and has 10 years of experience in studying price action. His areas of expertise include intermarket analysis on the equities, currencies, commodities and bonds market.
He is also a regular columnist on The Business Times - every Monday ChartPoint column.
He graduated with a Bachelor of Science in Banking and Finance from University of London.
