
Tradable instruments:
ETF:
The SPDR Dow Jones Industrial Average ETF tracks a price weighted index of 30 large cap US stocks
The SPDR S&P 500 ETF tracks a market cap weighted index of US large and midcap stocks selected by the S&P Committee
The Powershares QQQ tracks a modified market cap weighted index of 100 NASDAQ listed stocks.
CFD:
– Nearing the end of the current economic expansionary cycle
– Extreme optimism, complacency and greed are showing up
– However, sentiment indicators, price action and interest rate related metrics are not flashing red yet
– General equity market should continue to grind higher until the major indicators signal danger
With the US equity market climbing to new highs, we thought it would be a good time to review the strength of the bull market. From a cyclical economic point of view, we are nearing the end of the expansionary phase where it all started back in June 2009. The current economic expansion is the third longest in history at 98 months, which means a recessionary cycle is about to take over once the current expansionary cycle ends. Each expansionary cycle is met with some form of crisis that leads to a recession with the two most recent crisis resulting in a 50% wipe in the S&P 500. Expansionary cycles are defined as positive QoQ GDP growth while contractionary cycles are defined as negative QoQ GDP growth. The average expansionary cycle is about 60 months, and the longest economic expansion was 119 months during the 1990 decade while the second longest economic expansion lasted for 107 months during the 1960 decade.
Figure 1. Economic cycle – Current economic expansion is the third longest in history
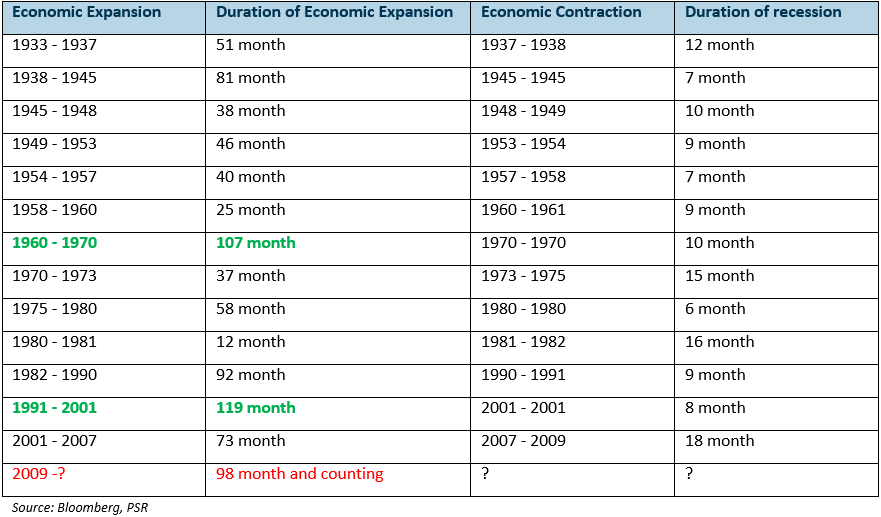
The noteworthy part is the current 98 months of economic expansion has outlasted the previous cycle of 73 months where the Global Financial Crisis happened. History does not repeat but often rhymes. Hence, we are not calling the market to top out now with the economic cycle but emphasising the end of the expansion cycle is nearing.
Extreme greed and optimism are a great signal for late stage economic cycle, and the following indicators are suggesting it:
Figure 2. Equity VIX – hitting a low of 8.84, last seen in 2006 just before GFC blew up
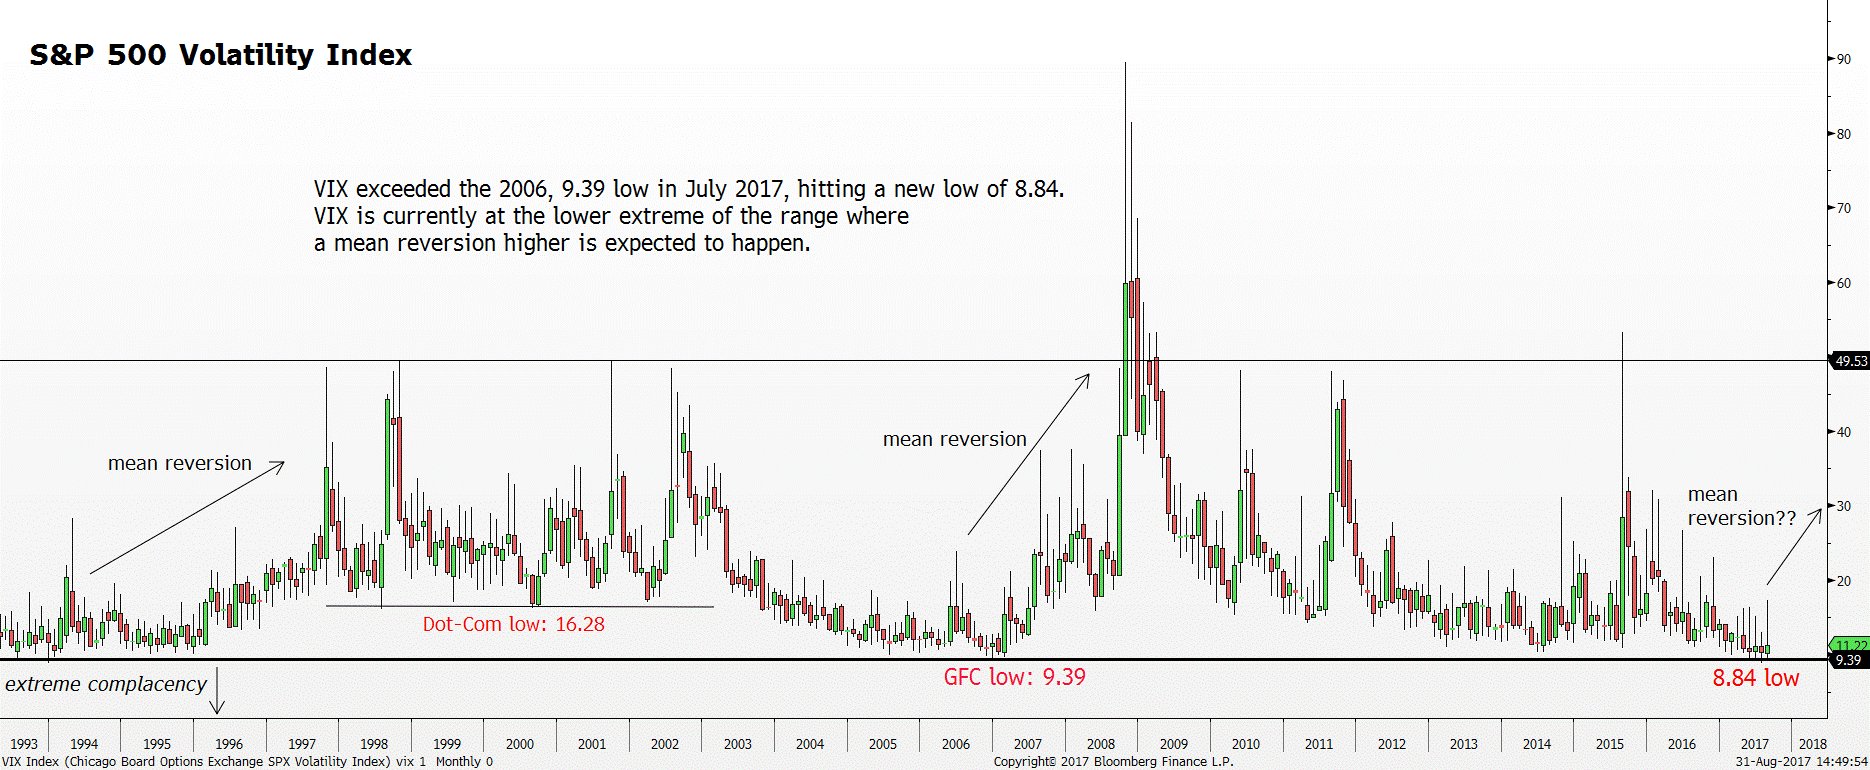
Figure 3. Non-Commercial short contracts VIX Futures – hitting unprecedented high showing extreme greed and complacency
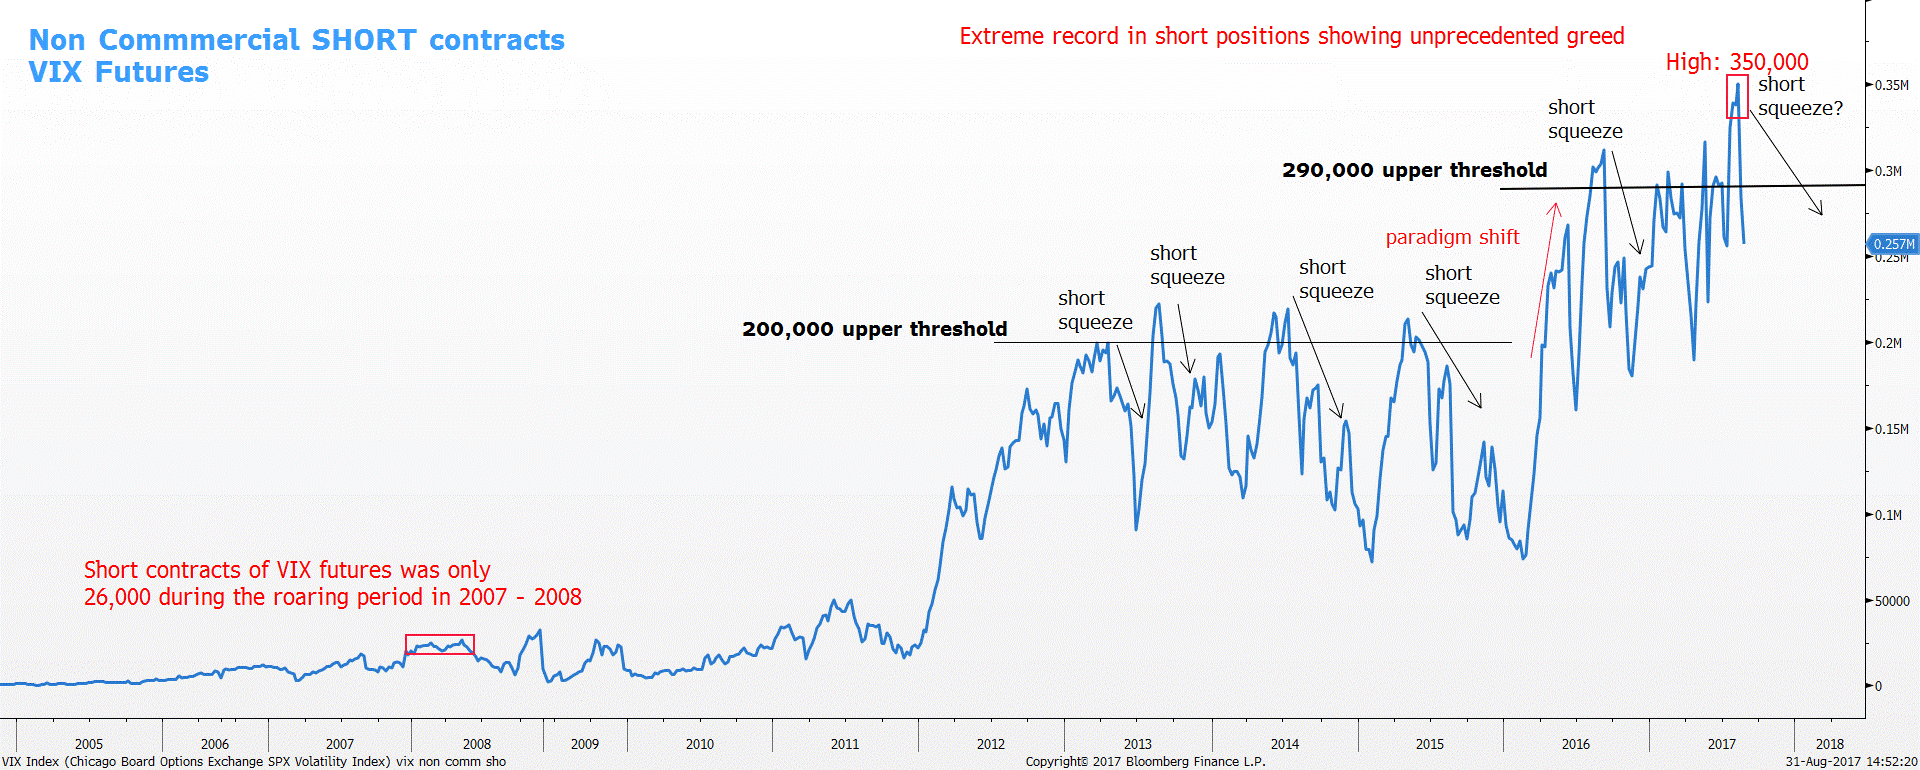
Figure 4. Treasury VIX – hitting a low of 4.00 in July 2017, surpassing the GFC low of 4.22 showing extreme complacency
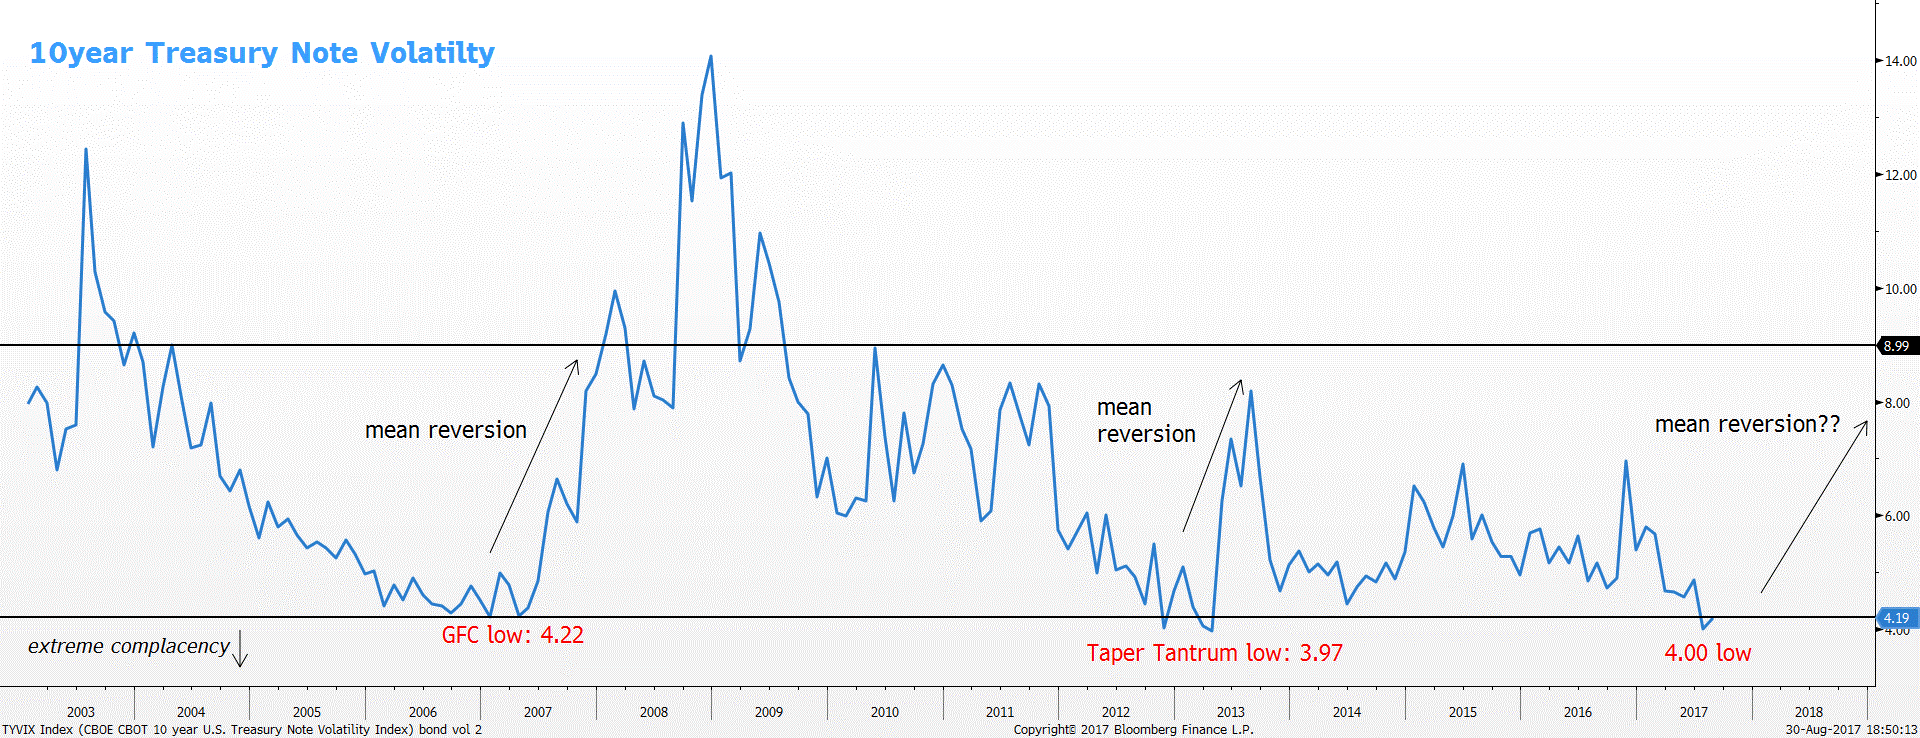
Figure 5. Conference Board Consumer Confidence – exceeding pre-crisis highs
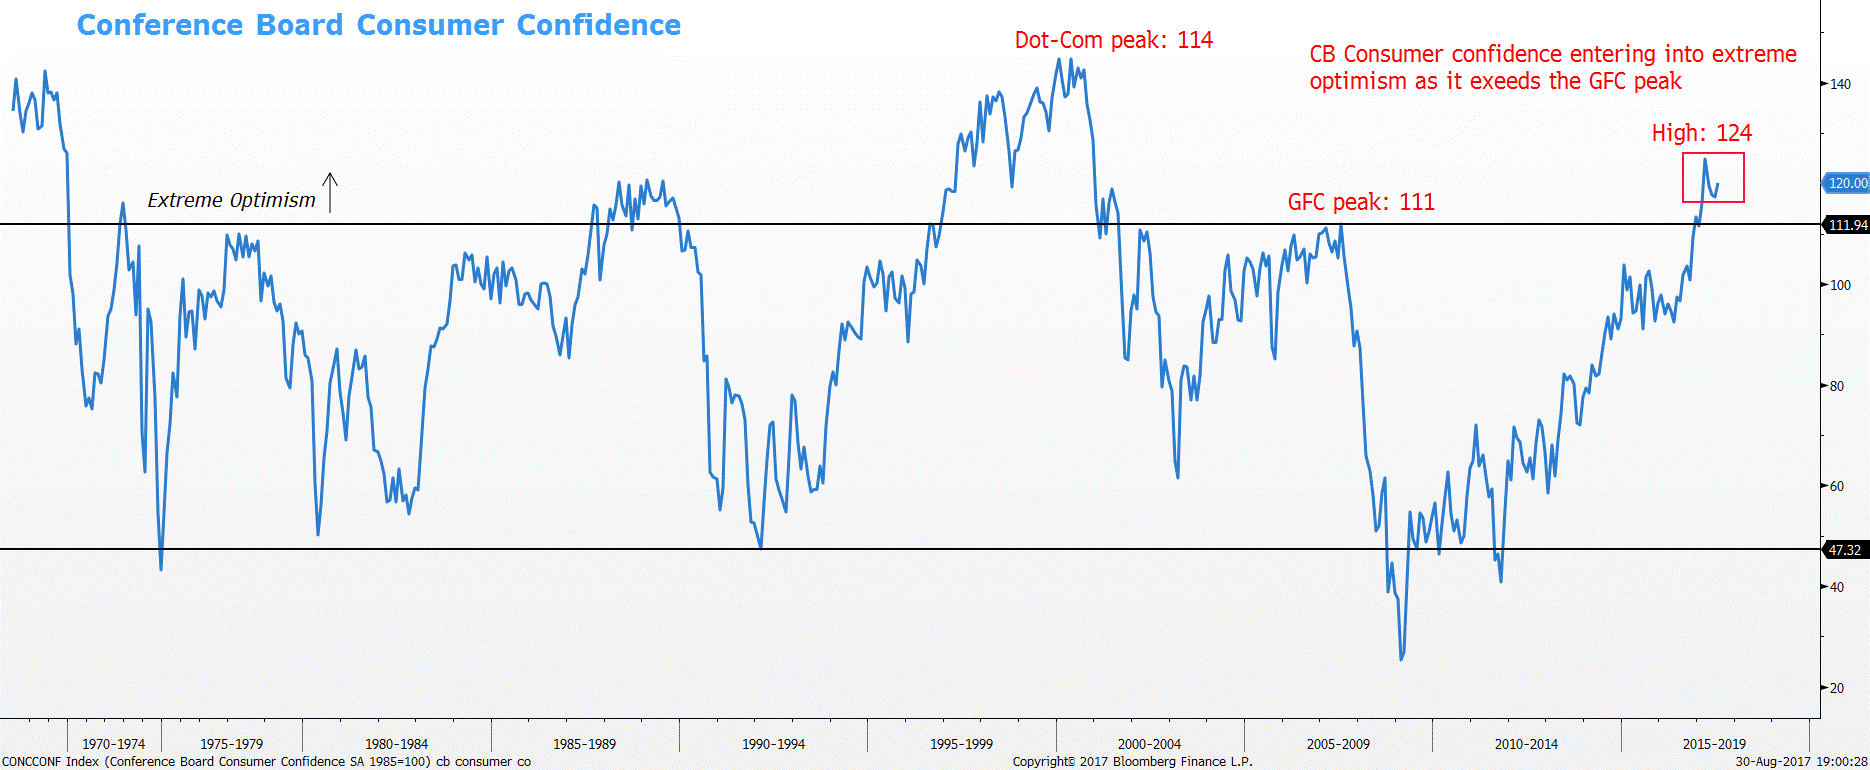
Figure 6. Umich Consumer Sentiment – exceeding pre-crisis highs
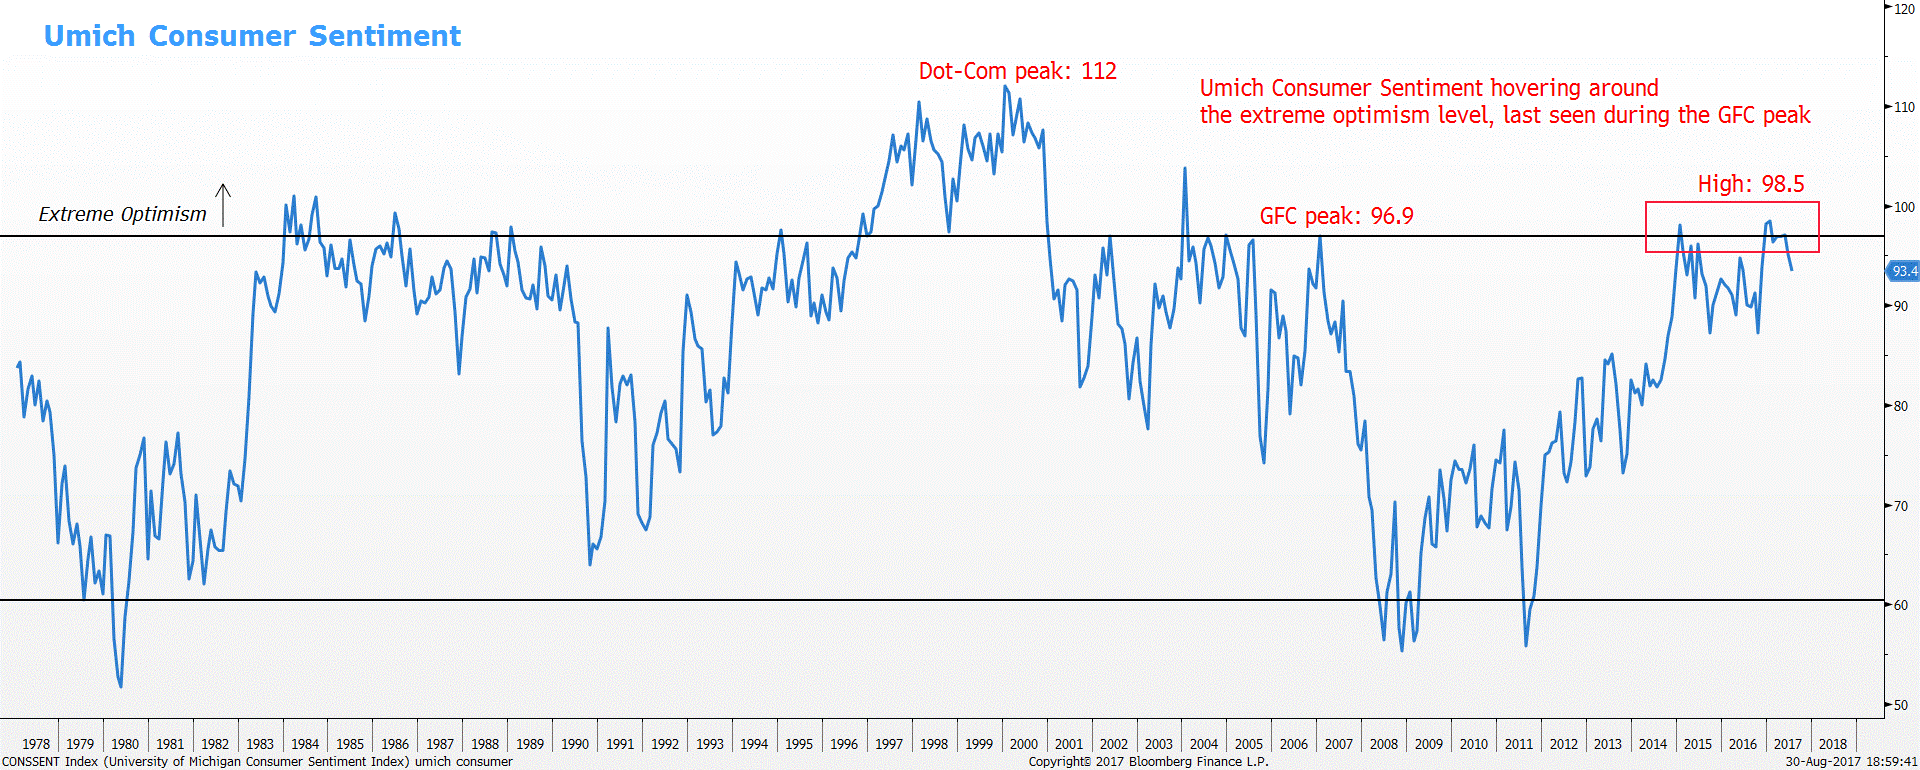
Figure 7. Bloomberg Consumer Comfort – exceeding pre-crisis highs
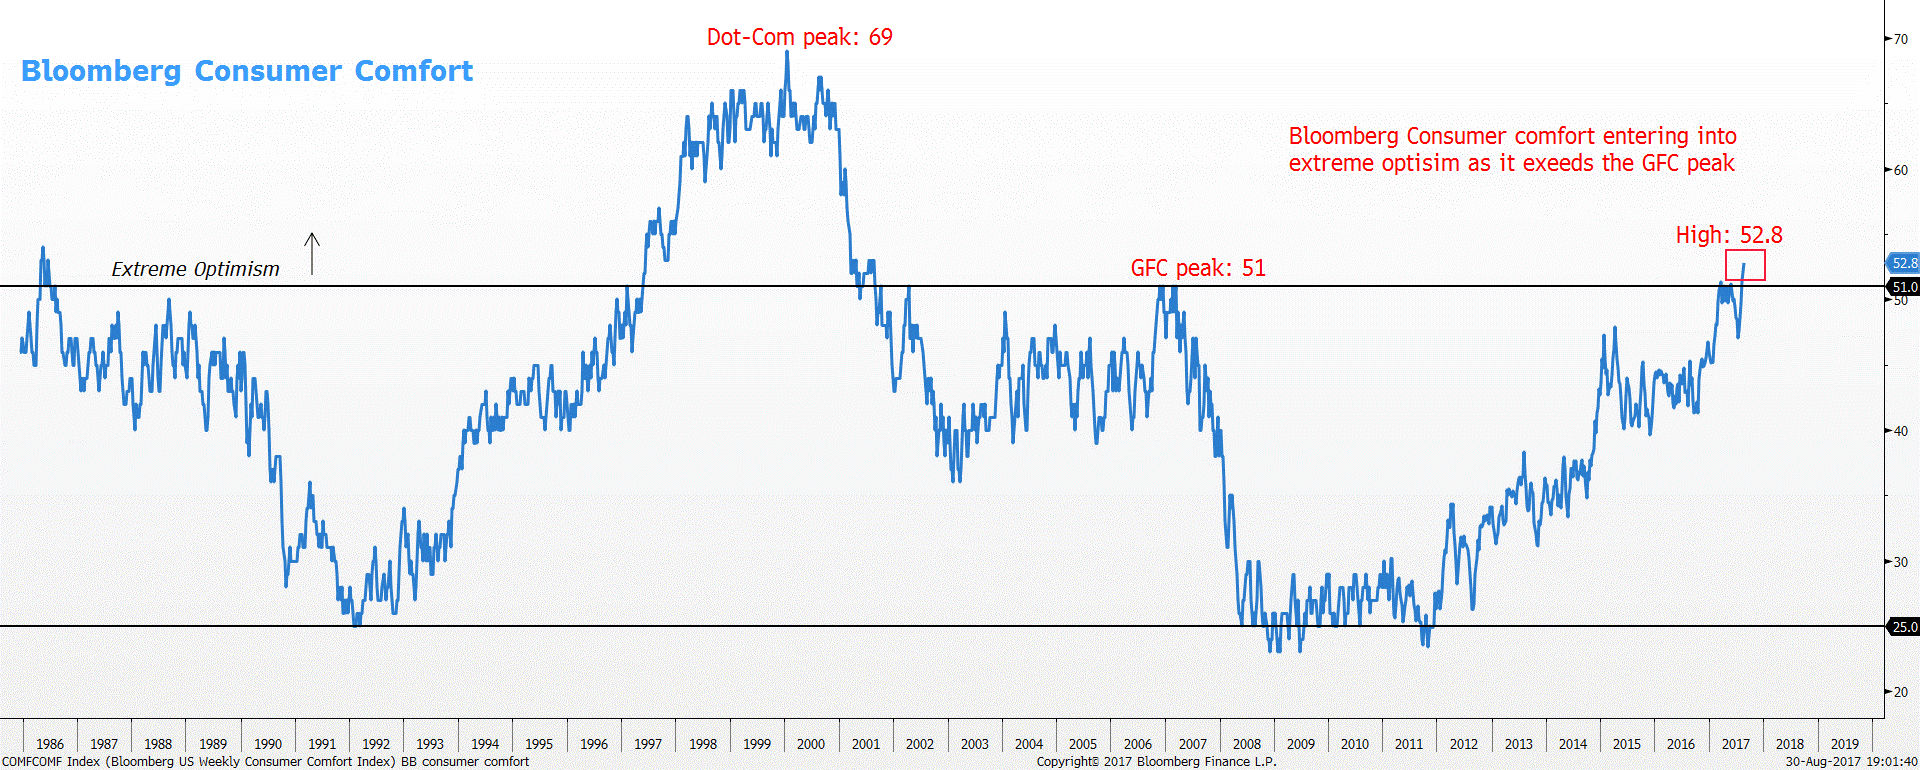
Figure 8. Unemployment rate – recent low of 4.4%, last seen in 2001
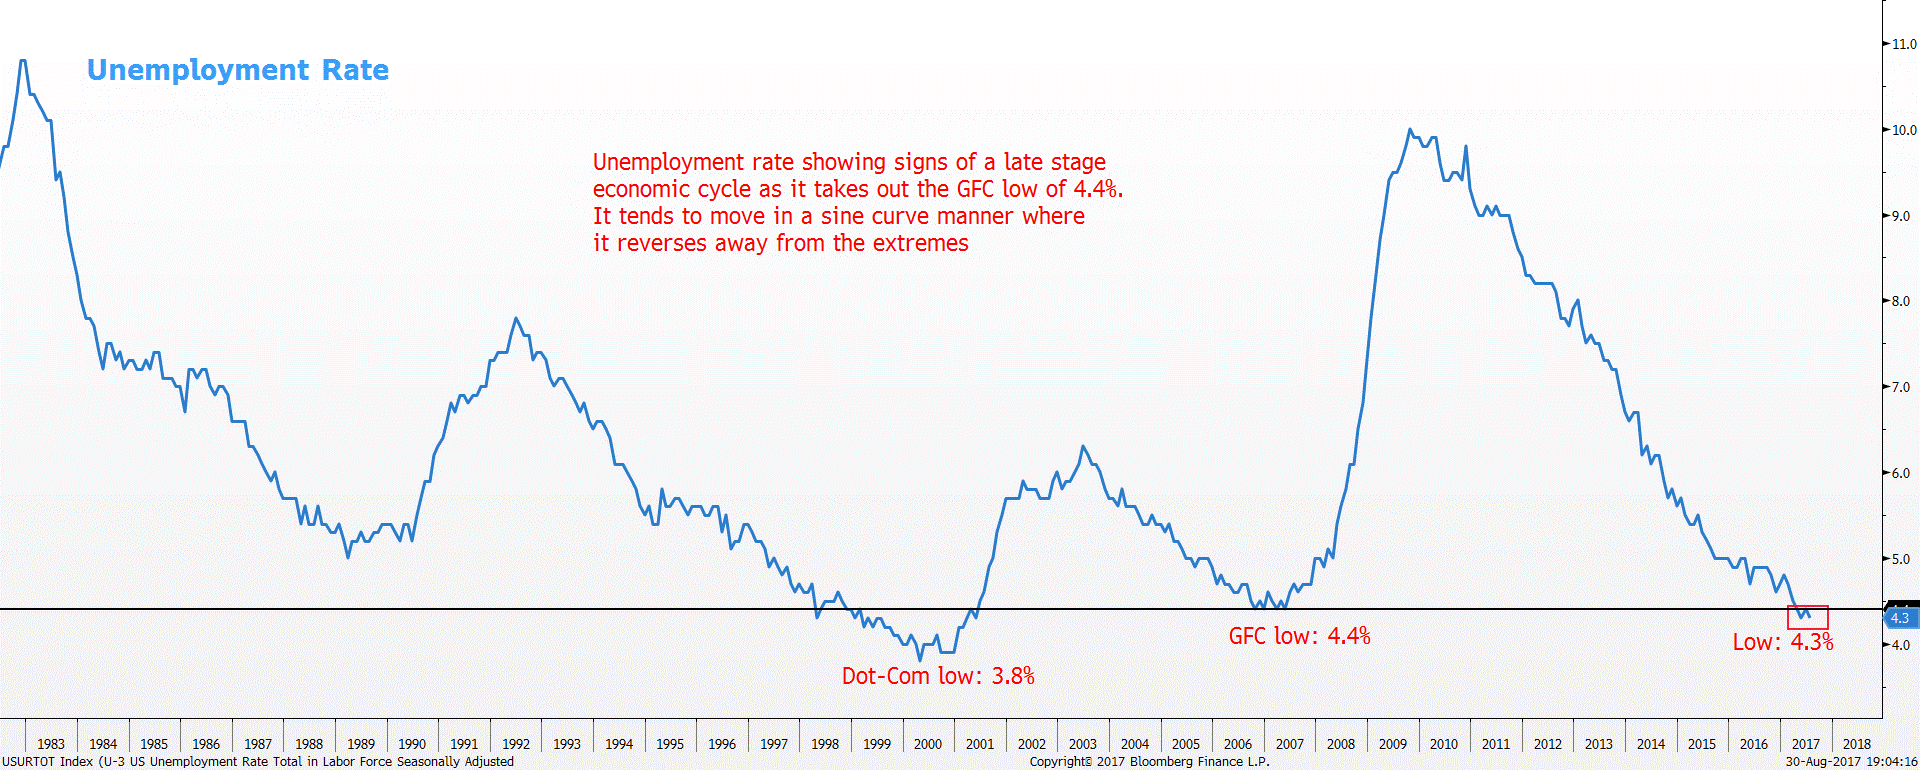
Figure 9. Unemployment claims – lowest since 1973
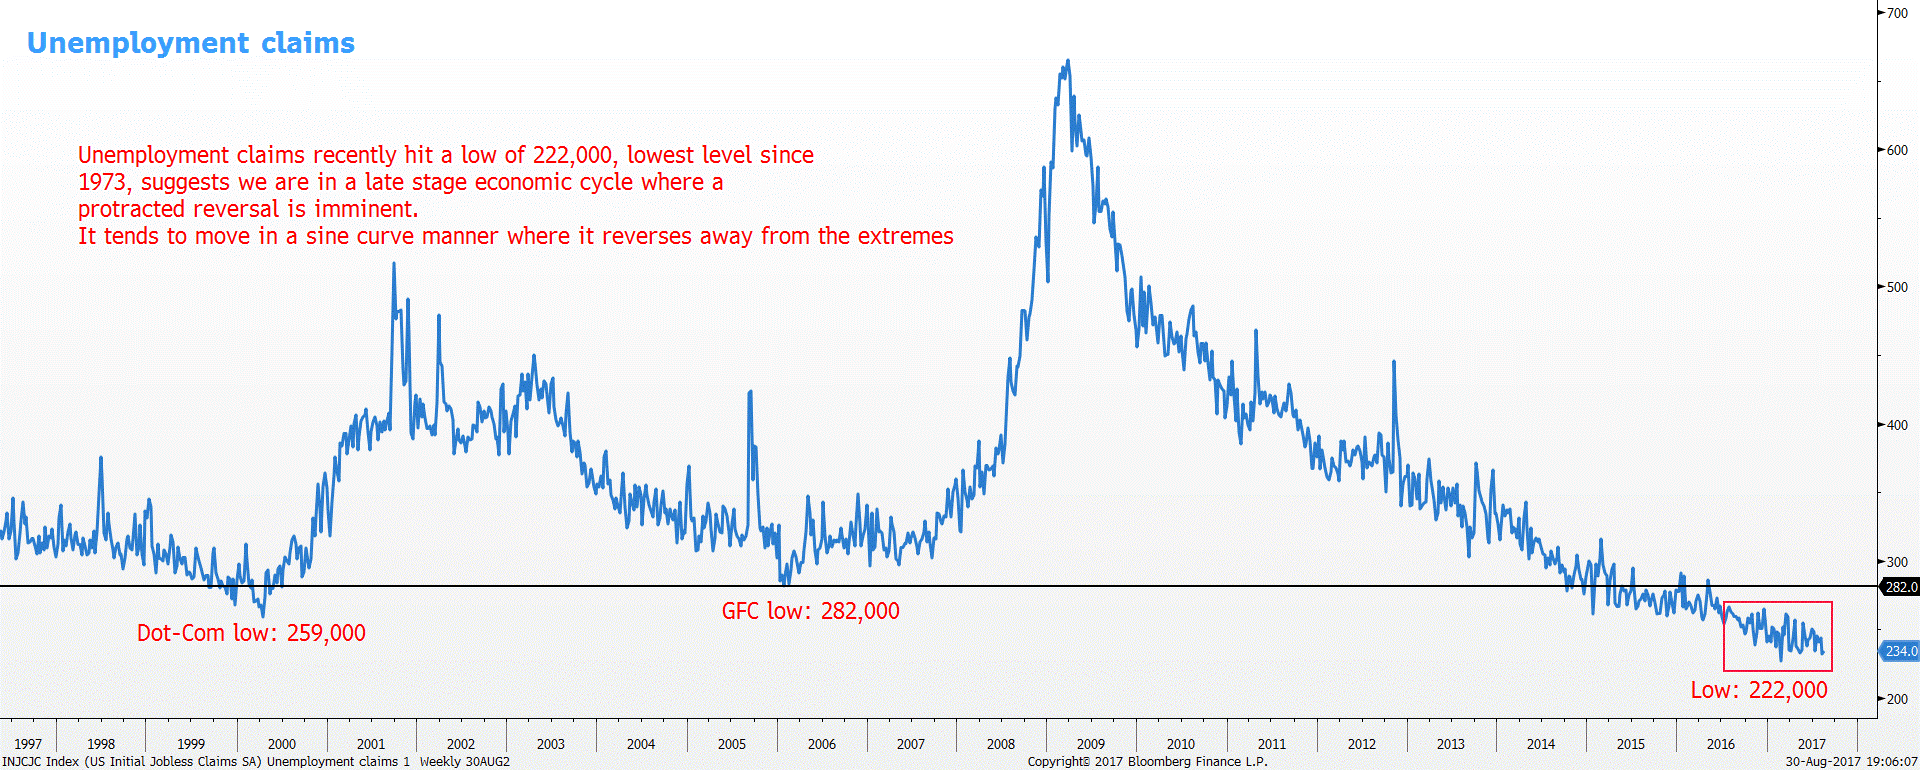
Figure 10. Margin Debt – at an all-time high of $550B, 44% above GFC peak
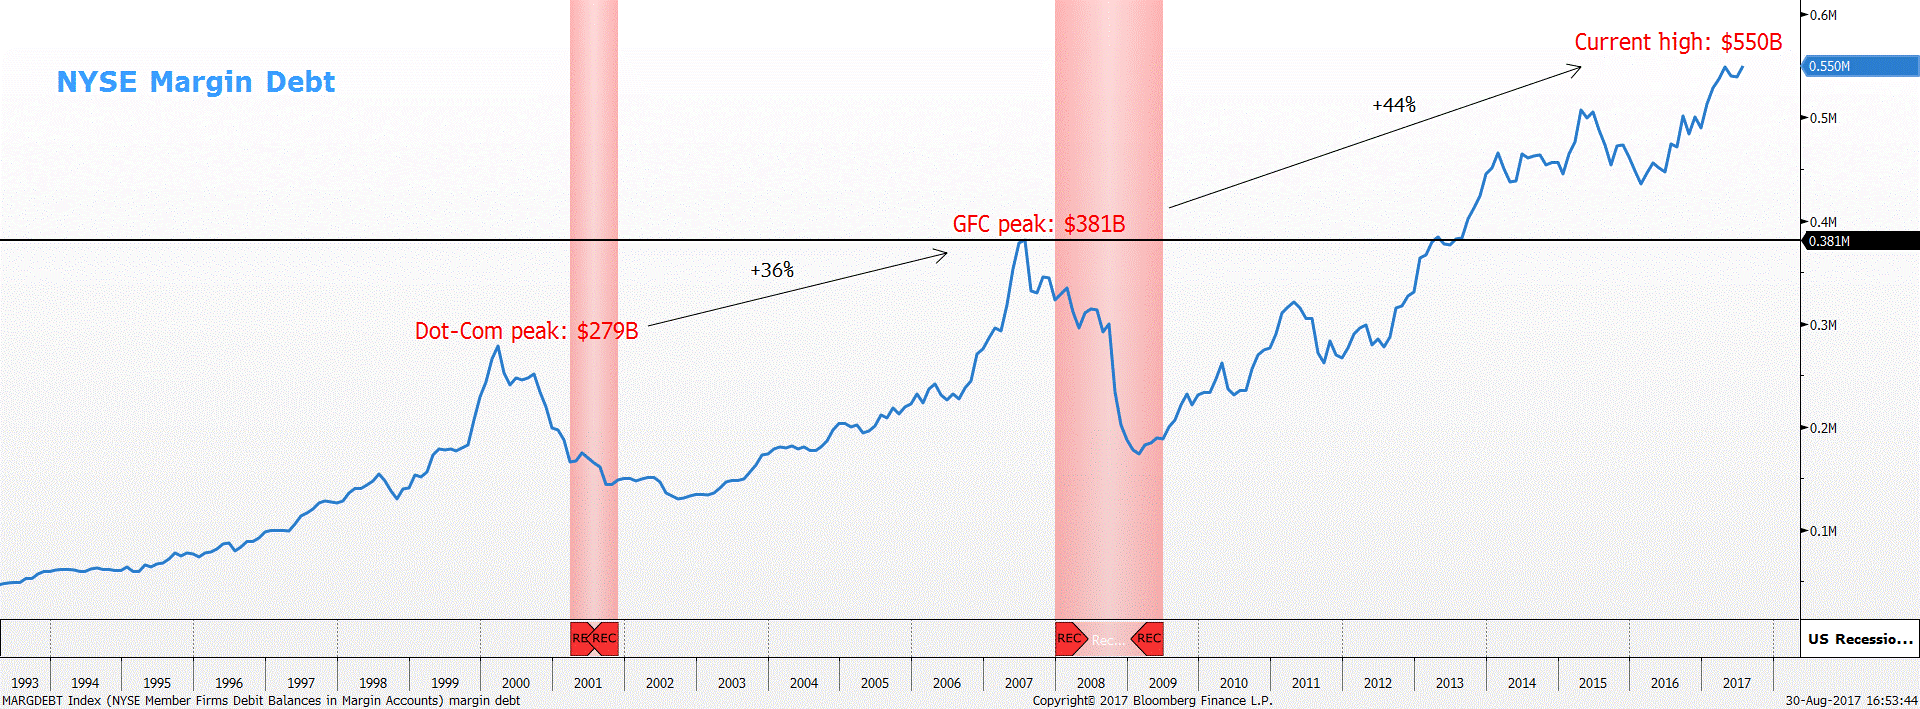
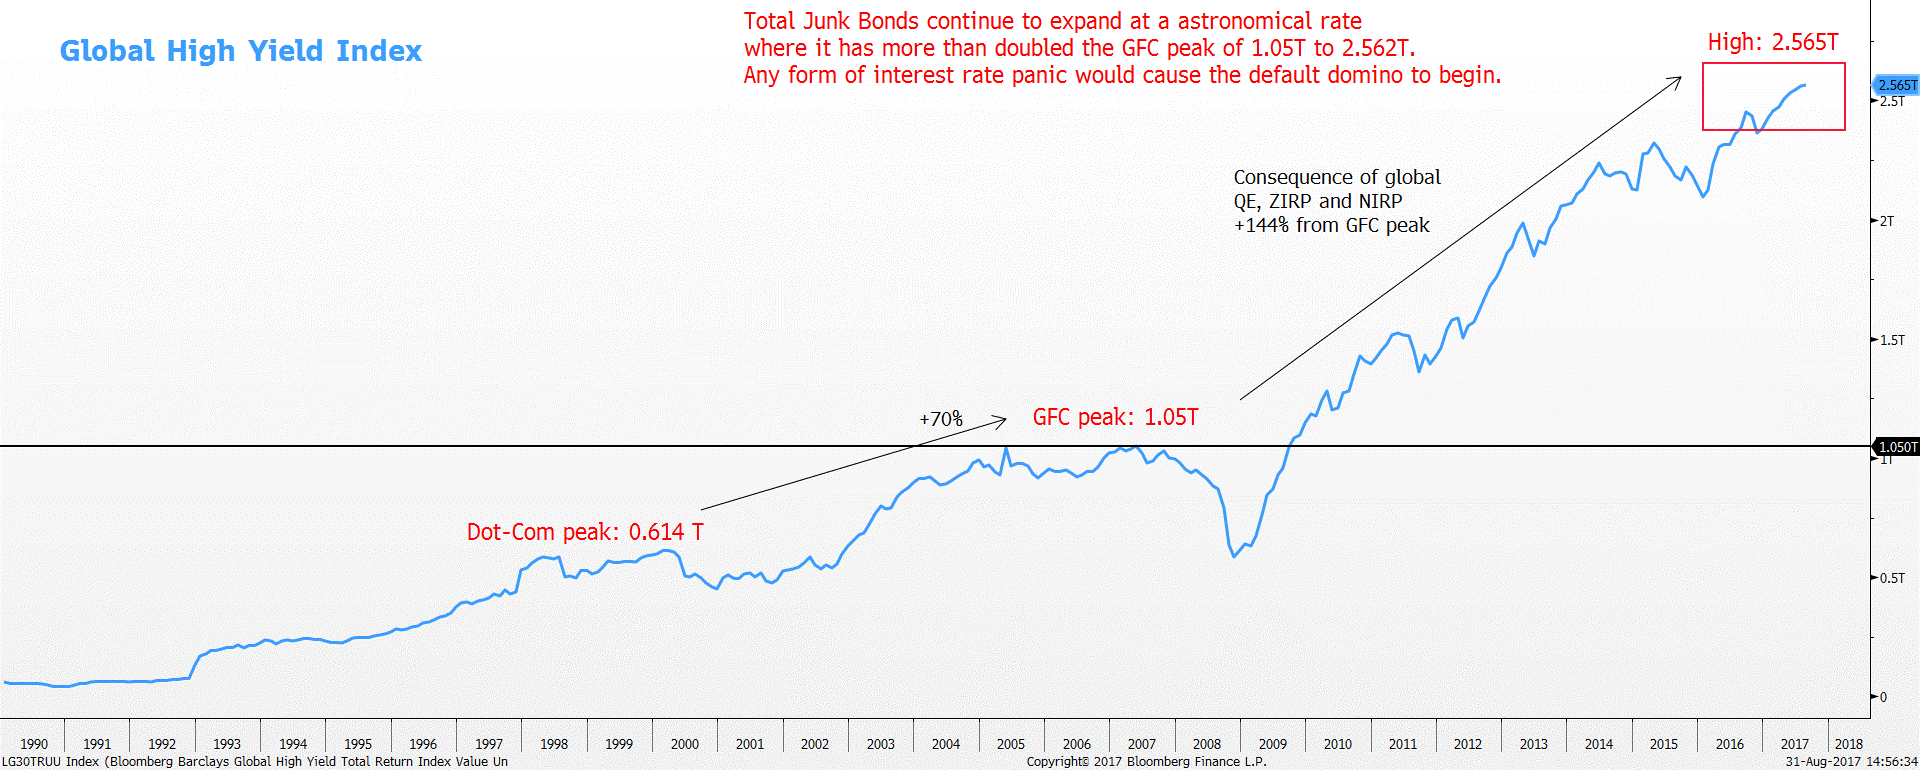
Figure 11. Global Junk Bond – more than doubled from GFC peak, currently at $2.5T
Source: Bloomberg, PSR
As the end of the expansionary cycle is in sight, we did a study to display some indicators to warn about the upcoming top in the US equity market. The indicators can be divided into four main categories, namely;
We believe the voluntary or involuntary spike in interest rate will ultimately be the cause for the next crisis with the consequence of global Quantitative Easing and the ongoing excessive debt binge the world has taken on due to the extended zero interest rate and negative interest rate policy around the world. Especially, when the debt level has already exceeded the pre-crisis level. It will be a similar replay of what happened during the subprime panic, but this time on a way bigger scale as the adjustment of the teaser interest rate resulted in the mass default of subprime holders and ultimately causing a carnage.
Important Information
This report is prepared and/or distributed by Phillip Securities Research Pte Ltd ("Phillip Securities Research"), which is a holder of a financial adviser’s licence under the Financial Advisers Act, Chapter 110 in Singapore.
By receiving or reading this report, you agree to be bound by the terms and limitations set out below. Any failure to comply with these terms and limitations may constitute a violation of law. This report has been provided to you for personal use only and shall not be reproduced, distributed or published by you in whole or in part, for any purpose. If you have received this report by mistake, please delete or destroy it, and notify the sender immediately.
The information and any analysis, forecasts, projections, expectations and opinions (collectively, the “Research”) contained in this report has been obtained from public sources which Phillip Securities Research believes to be reliable. However, Phillip Securities Research does not make any representation or warranty, express or implied that such information or Research is accurate, complete or appropriate or should be relied upon as such. Any such information or Research contained in this report is subject to change, and Phillip Securities Research shall not have any responsibility to maintain or update the information or Research made available or to supply any corrections, updates or releases in connection therewith.
Any opinions, forecasts, assumptions, estimates, valuations and prices contained in this report are as of the date indicated and are subject to change at any time without prior notice. Past performance of any product referred to in this report is not indicative of future results.
This report does not constitute, and should not be used as a substitute for, tax, legal or investment advice. This report should not be relied upon exclusively or as authoritative, without further being subject to the recipient’s own independent verification and exercise of judgment. The fact that this report has been made available constitutes neither a recommendation to enter into a particular transaction, nor a representation that any product described in this report is suitable or appropriate for the recipient. Recipients should be aware that many of the products, which may be described in this report involve significant risks and may not be suitable for all investors, and that any decision to enter into transactions involving such products should not be made, unless all such risks are understood and an independent determination has been made that such transactions would be appropriate. Any discussion of the risks contained herein with respect to any product should not be considered to be a disclosure of all risks or a complete discussion of such risks.
Nothing in this report shall be construed to be an offer or solicitation for the purchase or sale of any product. Any decision to purchase any product mentioned in this report should take into account existing public information, including any registered prospectus in respect of such product.
Phillip Securities Research, or persons associated with or connected to Phillip Securities Research, including but not limited to its officers, directors, employees or persons involved in the issuance of this report, may provide an array of financial services to a large number of corporations in Singapore and worldwide, including but not limited to commercial / investment banking activities (including sponsorship, financial advisory or underwriting activities), brokerage or securities trading activities. Phillip Securities Research, or persons associated with or connected to Phillip Securities Research, including but not limited to its officers, directors, employees or persons involved in the issuance of this report, may have participated in or invested in transactions with the issuer(s) of the securities mentioned in this report, and may have performed services for or solicited business from such issuers. Additionally, Phillip Securities Research, or persons associated with or connected to Phillip Securities Research, including but not limited to its officers, directors, employees or persons involved in the issuance of this report, may have provided advice or investment services to such companies and investments or related investments, as may be mentioned in this report.
Phillip Securities Research or persons associated with or connected to Phillip Securities Research, including but not limited to its officers, directors, employees or persons involved in the issuance of this report may, from time to time maintain a long or short position in securities referred to herein, or in related futures or options, purchase or sell, make a market in, or engage in any other transaction involving such securities, and earn brokerage or other compensation in respect of the foregoing. Investments will be denominated in various currencies including US dollars and Euro and thus will be subject to any fluctuation in exchange rates between US dollars and Euro or foreign currencies and the currency of your own jurisdiction. Such fluctuations may have an adverse effect on the value, price or income return of the investment.
To the extent permitted by law, Phillip Securities Research, or persons associated with or connected to Phillip Securities Research, including but not limited to its officers, directors, employees or persons involved in the issuance of this report, may at any time engage in any of the above activities as set out above or otherwise hold an interest, whether material or not, in respect of companies and investments or related investments, which may be mentioned in this report. Accordingly, information may be available to Phillip Securities Research, or persons associated with or connected to Phillip Securities Research, including but not limited to its officers, directors, employees or persons involved in the issuance of this report, which is not reflected in this report, and Phillip Securities Research, or persons associated with or connected to Phillip Securities Research, including but not limited to its officers, directors, employees or persons involved in the issuance of this report, may, to the extent permitted by law, have acted upon or used the information prior to or immediately following its publication. Phillip Securities Research, or persons associated with or connected to Phillip Securities Research, including but not limited its officers, directors, employees or persons involved in the issuance of this report, may have issued other material that is inconsistent with, or reach different conclusions from, the contents of this report.
The information, tools and material presented herein are not directed, intended for distribution to or use by, any person or entity in any jurisdiction or country where such distribution, publication, availability or use would be contrary to the applicable law or regulation or which would subject Phillip Securities Research to any registration or licensing or other requirement, or penalty for contravention of such requirements within such jurisdiction.
This report is intended for general circulation only and does not take into account the specific investment objectives, financial situation or particular needs of any particular person. The products mentioned in this report may not be suitable for all investors and a person receiving or reading this report should seek advice from a professional and financial adviser regarding the legal, business, financial, tax and other aspects including the suitability of such products, taking into account the specific investment objectives, financial situation or particular needs of that person, before making a commitment to invest in any of such products.
This report is not intended for distribution, publication to or use by any person in any jurisdiction outside of Singapore or any other jurisdiction as Phillip Securities Research may determine in its absolute discretion.
IMPORTANT DISCLOSURES FOR INCLUDED RESEARCH ANALYSES OR REPORTS OF FOREIGN RESEARCH HOUSE
Where the report contains research analyses or reports from a foreign research house, please note:

Jeremy specialises in Technical Analysis and has 10 years of experience in studying price action. His areas of expertise include intermarket analysis on the equities, currencies, commodities and bonds market.
He is also a regular columnist on The Business Times - every Monday ChartPoint column.
He graduated with a Bachelor of Science in Banking and Finance from University of London.
