
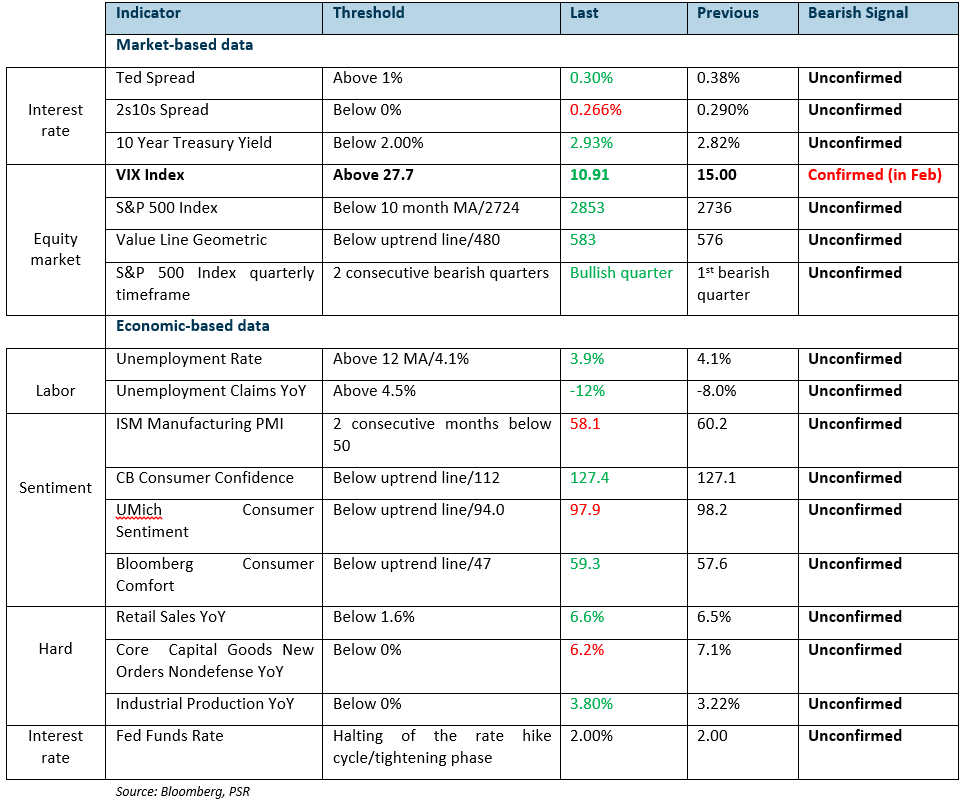
Our Phillip recession tracker is based on 17 market-based and economic-based indicators. The threshold represents the levels where bearish signal arises.
Red/Green represents deterioration/improvement from the prior month. Otherwise, it is unchanged.For more information on how we decipher the recession tracker indicators, refer to the report
All clear for now
All clear for now part 2
Overall, the performance of the US equity market was rather strong in July despite the ongoing trade tension.
July performance:
DJIA: +4.7% S&P 500: +3.5% Nasdaq 100: +2.5%
Some of the key highlights in July that surrounded the markets are the Chinese Yuan devaluation and Trade War escalation. Nonetheless, these negative newsflow only affected the market minimally, and the strong economic data and the general beat in Q2 earnings ushered in the risk-on behaviour.
Chinese Yuan (USDCNH) devaluation likely to reverse near the 7.0000 psychological barrier
The Chinese equity market felt the brunt of the weakening Yuan as the USDCNH (offshore Yuan) continued to depreciate to a new 10-month high of 6.905. From the yearly low of 6.2357 in April, the offshore Yuan has devalued 9.6% against the USD translating to a -14% loss in the Shanghai Composite Index in the same period. Looking at the historical chart, it seems like the red line for the USDCNH is around the all-time high of 6.9863, formed back in December 2016.
The psychological big round number of 7.000 should be a major barrier if the offshore Yuan continues to devalue. Drawing some correlation shows that the PBOC is deliberately devaluing the Chinese Yuan to combat the tariffs on Chinese goods since April.
In other words, the trade war rhetoric should fade away once the PBOC halts the Yuan devaluation near the 7.0000 psychological round number. All in, that should first bode well with the Chinese equity market where we expect a strong reversal higher in the Shanghai Composite Index. On the flipside, the de-escalation of the trade tensions between the US and China should also bring back further risk-on appetite into the US equity market as the uncertainty from the trade war aspect eases away.
Figure 1: USDCNH likely to remain capped at 6.9863 – 7.0000 psychological area
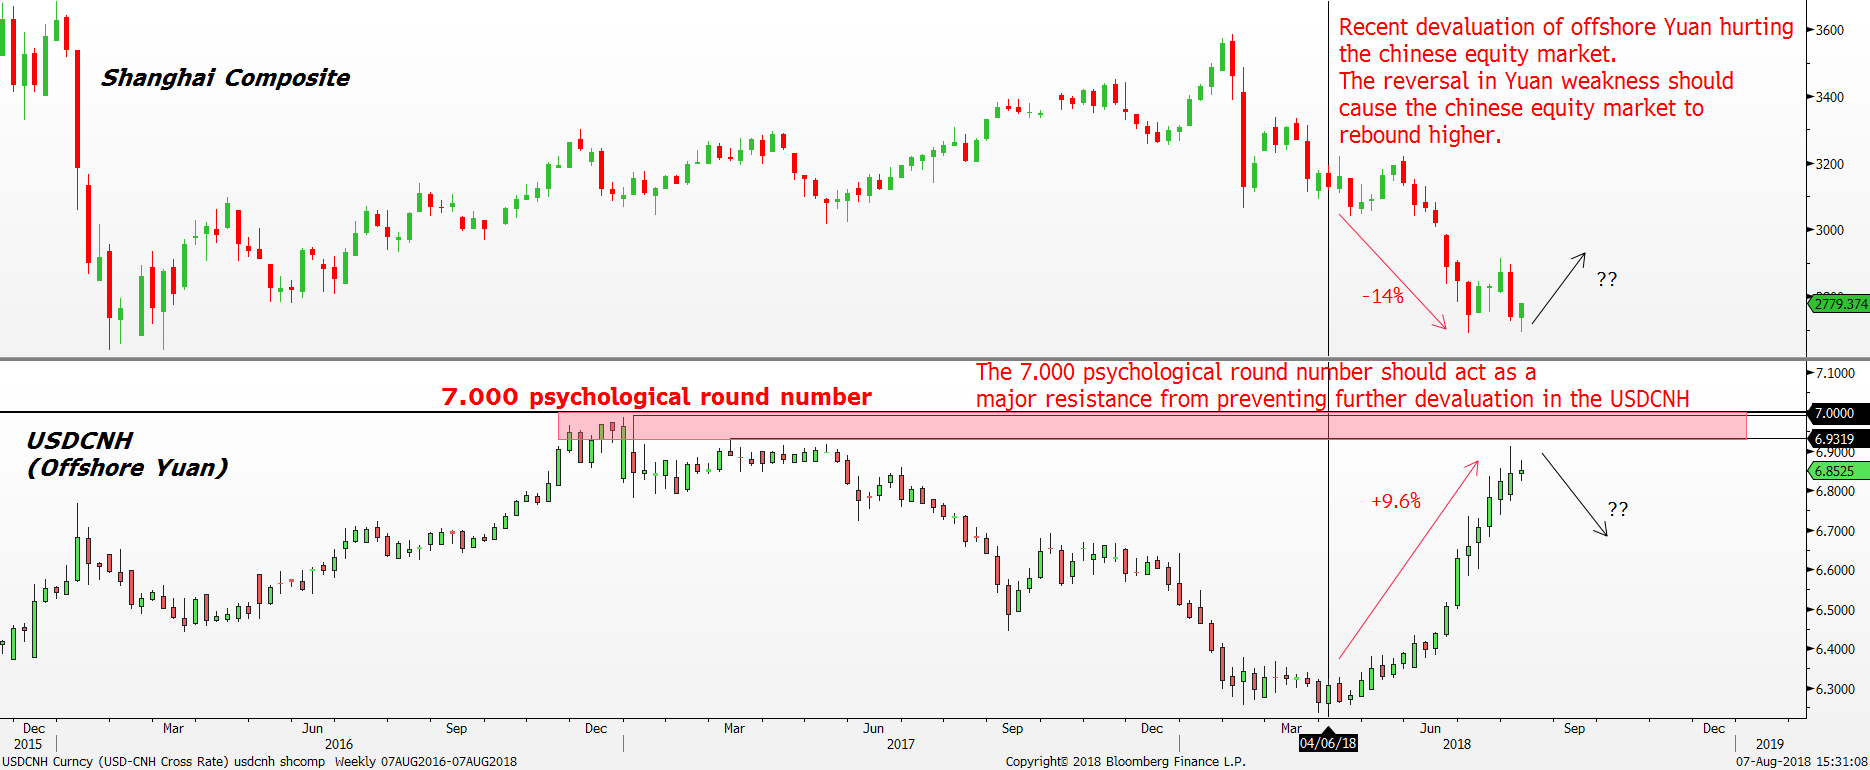
Shanghai Composite vs USDCNH Monthly chart
Trade escalation having less impact on the market
Trade conflict remains the main highlight in July as the US further threatened to increase the size of the tariff from 10% to 25% on $200 billion worth of Chinese goods. This is after the US imposed 25% tariffs on $34 billion of Chinese products in early July. The news of this escalation came on 1 August, but it appears the market is getting used to the trade war scare as the negative impact on the US equity market was short-lived. For example, the S&P 500 index only fell –1.2% over the following two days before buyers reappeared to turn things around. We have mentioned in the June review that the trade tension inspired selloffs are getting a smaller negative impact on the equity market each time and the recent escalation on 1 August further confirms the idea.
Figure 2: Market shrugging off the trade tension news
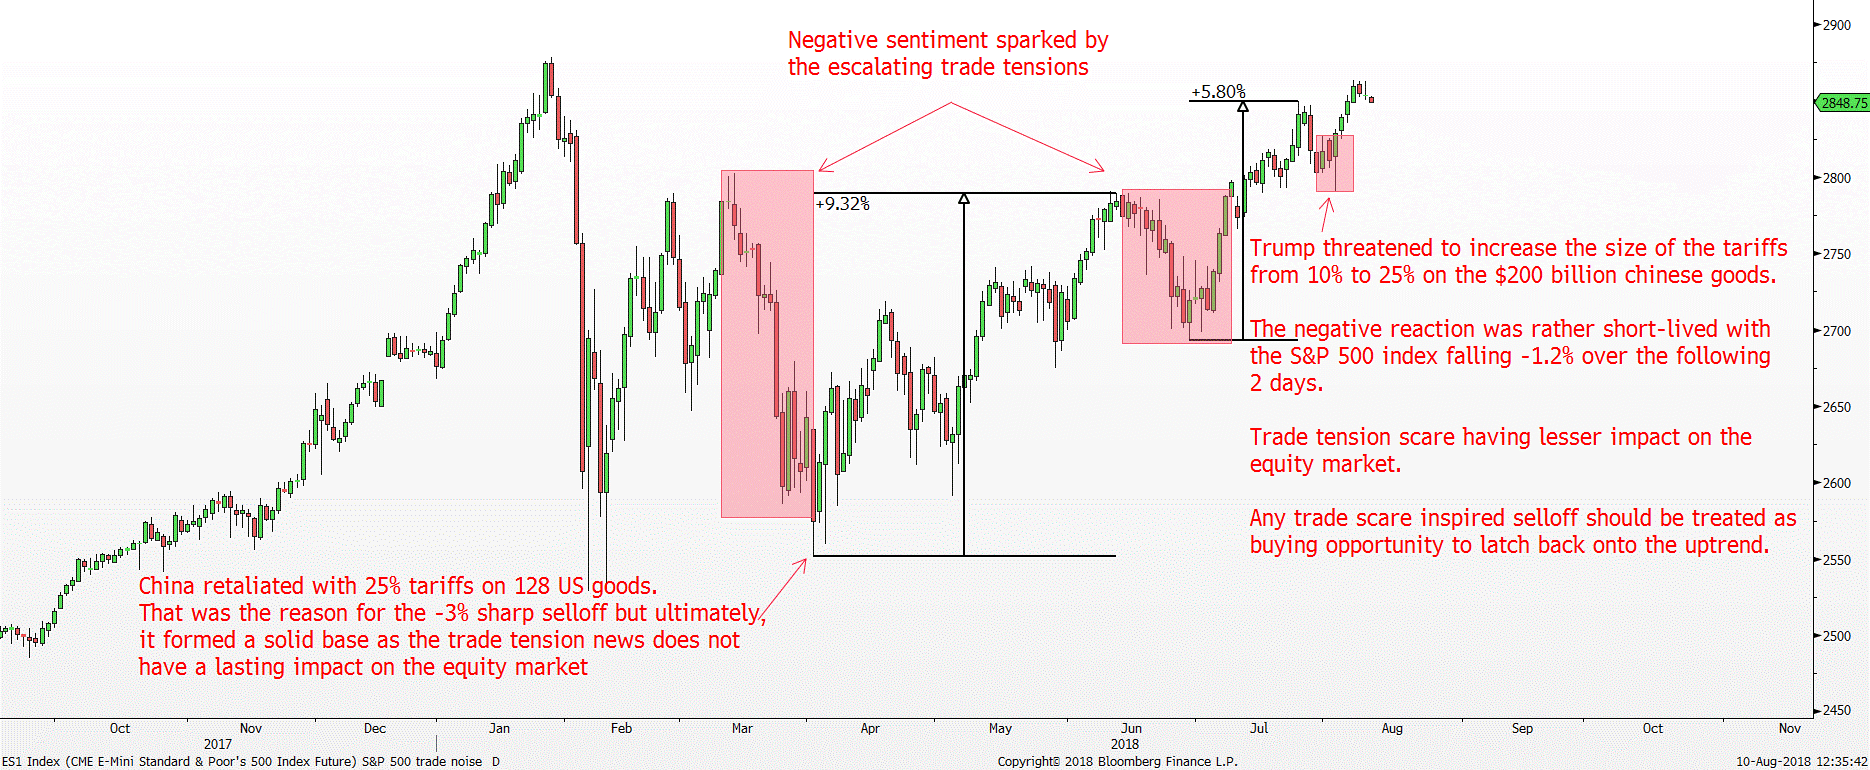
Hence, moving forward, expect the market to be less affected by the trade war tensions and any selloff caused by the trade scare should be used to reposition back into the equity market to ride out further upside. Despite China retaliating with announcing tariffs on $60bn of US imports on 3 August, the equity market remains unfazed.
Market participants are paying more attention to the overall earnings this time around. Apple showed some stellar performance. With the positive results, Apple became the first company in the US to achieve a market capitalisation of $1 trillion, surpassing $203.50 per share. In summary, the market cheered on a better than expected top and bottom line. Apple reported Q3 earnings per share (EPS) of $2.34 as compared to the expectation of $2.18. Revenue for Q3 was up 17% YoY to $53.3 billion, beating expectations of $52.4 billion. The Q4 revenue guidance was another major catalyst for the rally in Apple’s share price. Apple’s Q4 revenue forecast expects revenue to range between $60 billion and $62 billion, way above analyst estimates of $59.4 billion
This positive results also ushered in a feel-good effect to the rest of the equity market lifting the DJIA, S&P 500 index and more so the Nasdaq 100 index back into the uptrend.
Overall, the company earnings for Q2 2018 are beating the market’s expectations to the upside and hence, we should continue to see further risk-on appetite flowing back into the market. To date, more than three-quarters of the companies in the S&P 500 index have reported their results for Q2 2018. Of which, 80% have reported a positive EPS surprise while 74% have reported a positive sales surprise.
Important Information
This report is prepared and/or distributed by Phillip Securities Research Pte Ltd ("Phillip Securities Research"), which is a holder of a financial adviser’s licence under the Financial Advisers Act, Chapter 110 in Singapore.
By receiving or reading this report, you agree to be bound by the terms and limitations set out below. Any failure to comply with these terms and limitations may constitute a violation of law. This report has been provided to you for personal use only and shall not be reproduced, distributed or published by you in whole or in part, for any purpose. If you have received this report by mistake, please delete or destroy it, and notify the sender immediately.
The information and any analysis, forecasts, projections, expectations and opinions (collectively, the “Research”) contained in this report has been obtained from public sources which Phillip Securities Research believes to be reliable. However, Phillip Securities Research does not make any representation or warranty, express or implied that such information or Research is accurate, complete or appropriate or should be relied upon as such. Any such information or Research contained in this report is subject to change, and Phillip Securities Research shall not have any responsibility to maintain or update the information or Research made available or to supply any corrections, updates or releases in connection therewith.
Any opinions, forecasts, assumptions, estimates, valuations and prices contained in this report are as of the date indicated and are subject to change at any time without prior notice. Past performance of any product referred to in this report is not indicative of future results.
This report does not constitute, and should not be used as a substitute for, tax, legal or investment advice. This report should not be relied upon exclusively or as authoritative, without further being subject to the recipient’s own independent verification and exercise of judgment. The fact that this report has been made available constitutes neither a recommendation to enter into a particular transaction, nor a representation that any product described in this report is suitable or appropriate for the recipient. Recipients should be aware that many of the products, which may be described in this report involve significant risks and may not be suitable for all investors, and that any decision to enter into transactions involving such products should not be made, unless all such risks are understood and an independent determination has been made that such transactions would be appropriate. Any discussion of the risks contained herein with respect to any product should not be considered to be a disclosure of all risks or a complete discussion of such risks.
Nothing in this report shall be construed to be an offer or solicitation for the purchase or sale of any product. Any decision to purchase any product mentioned in this report should take into account existing public information, including any registered prospectus in respect of such product.
Phillip Securities Research, or persons associated with or connected to Phillip Securities Research, including but not limited to its officers, directors, employees or persons involved in the issuance of this report, may provide an array of financial services to a large number of corporations in Singapore and worldwide, including but not limited to commercial / investment banking activities (including sponsorship, financial advisory or underwriting activities), brokerage or securities trading activities. Phillip Securities Research, or persons associated with or connected to Phillip Securities Research, including but not limited to its officers, directors, employees or persons involved in the issuance of this report, may have participated in or invested in transactions with the issuer(s) of the securities mentioned in this report, and may have performed services for or solicited business from such issuers. Additionally, Phillip Securities Research, or persons associated with or connected to Phillip Securities Research, including but not limited to its officers, directors, employees or persons involved in the issuance of this report, may have provided advice or investment services to such companies and investments or related investments, as may be mentioned in this report.
Phillip Securities Research or persons associated with or connected to Phillip Securities Research, including but not limited to its officers, directors, employees or persons involved in the issuance of this report may, from time to time maintain a long or short position in securities referred to herein, or in related futures or options, purchase or sell, make a market in, or engage in any other transaction involving such securities, and earn brokerage or other compensation in respect of the foregoing. Investments will be denominated in various currencies including US dollars and Euro and thus will be subject to any fluctuation in exchange rates between US dollars and Euro or foreign currencies and the currency of your own jurisdiction. Such fluctuations may have an adverse effect on the value, price or income return of the investment.
To the extent permitted by law, Phillip Securities Research, or persons associated with or connected to Phillip Securities Research, including but not limited to its officers, directors, employees or persons involved in the issuance of this report, may at any time engage in any of the above activities as set out above or otherwise hold an interest, whether material or not, in respect of companies and investments or related investments, which may be mentioned in this report. Accordingly, information may be available to Phillip Securities Research, or persons associated with or connected to Phillip Securities Research, including but not limited to its officers, directors, employees or persons involved in the issuance of this report, which is not reflected in this report, and Phillip Securities Research, or persons associated with or connected to Phillip Securities Research, including but not limited to its officers, directors, employees or persons involved in the issuance of this report, may, to the extent permitted by law, have acted upon or used the information prior to or immediately following its publication. Phillip Securities Research, or persons associated with or connected to Phillip Securities Research, including but not limited its officers, directors, employees or persons involved in the issuance of this report, may have issued other material that is inconsistent with, or reach different conclusions from, the contents of this report.
The information, tools and material presented herein are not directed, intended for distribution to or use by, any person or entity in any jurisdiction or country where such distribution, publication, availability or use would be contrary to the applicable law or regulation or which would subject Phillip Securities Research to any registration or licensing or other requirement, or penalty for contravention of such requirements within such jurisdiction.
This report is intended for general circulation only and does not take into account the specific investment objectives, financial situation or particular needs of any particular person. The products mentioned in this report may not be suitable for all investors and a person receiving or reading this report should seek advice from a professional and financial adviser regarding the legal, business, financial, tax and other aspects including the suitability of such products, taking into account the specific investment objectives, financial situation or particular needs of that person, before making a commitment to invest in any of such products.
This report is not intended for distribution, publication to or use by any person in any jurisdiction outside of Singapore or any other jurisdiction as Phillip Securities Research may determine in its absolute discretion.
IMPORTANT DISCLOSURES FOR INCLUDED RESEARCH ANALYSES OR REPORTS OF FOREIGN RESEARCH HOUSE
Where the report contains research analyses or reports from a foreign research house, please note:

Jeremy specialises in Technical Analysis and has 10 years of experience in studying price action. His areas of expertise include intermarket analysis on the equities, currencies, commodities and bonds market.
He is also a regular columnist on The Business Times - every Monday ChartPoint column.
He graduated with a Bachelor of Science in Banking and Finance from University of London.
