
February was met with volatility storm as the VIX index spiked up more than 100% on 5 February while the S&P 500 index only fell by -4.9%. At one point, the VIX index spiked to a high of 50 on 6 February causing the market to go into a tailspin. The general equity market headed into a risk-off mode where we saw most equity indices from Asia, Emerging markets and European markets sold-off significantly in February.
The direct impact was seen in the US equity market where the S&P 500 index fell as much as -12% intra-month to a low of 2530 points before the buyers re-emerged. As a result, we saw some contagion effect from the US spreading to the Singapore market as well after the Volatility explosion event since 5 February. The STI suffered a substantial selloff of -7.5% as it hit an intra-month low of 3340 points.
Amidst the sharp selloff, we believe a recovery back into the uptrend is underway as the market stabilises. Our “Phillip Recession Tracker” which tracks the general strength of the US equity market still signalled risk-on mode as 14 out of 15 recession indicators remained well in check. Only the VIX index indicator had triggered the threshold of 27.8 but keep in the mind the general equity market does not form a top immediately after the threshold is triggered. Historically, it goes through a period of consolidation around a higher floor of 16 before the subsequent abnormally spikes above 30 signals further panic and turmoil.
Hence, we believe the US equity market will head back into a period of stabilisation where the uptrend retakes control. From a correlation perspective, we expect the risk-on sentiment from US to translate back into the rest of the world including Singapore. Moreover, the long-term correlation coefficient between the S&P 500 index and STI is north of 0.5 suggesting strong positive correlation. Thus, a risk-on sentiment in the US should also drive the STI back into the uptrend.
From a price action perspective on STI, after falling -7.5% off the 3611 high on 24 January to a low of 3340 points on 9 February, the subsequent strong bullish recovery has also shown some sign of strength. The STI rebounded off a critical support area at the 200 day moving average and 3341 support area, keeping the uptrend intact. The intraday low of 3340 points on 9 February should be the next higher low (HL) point for this uptrend.
STI Daily Chart – uptrend held up by the 3340 support area
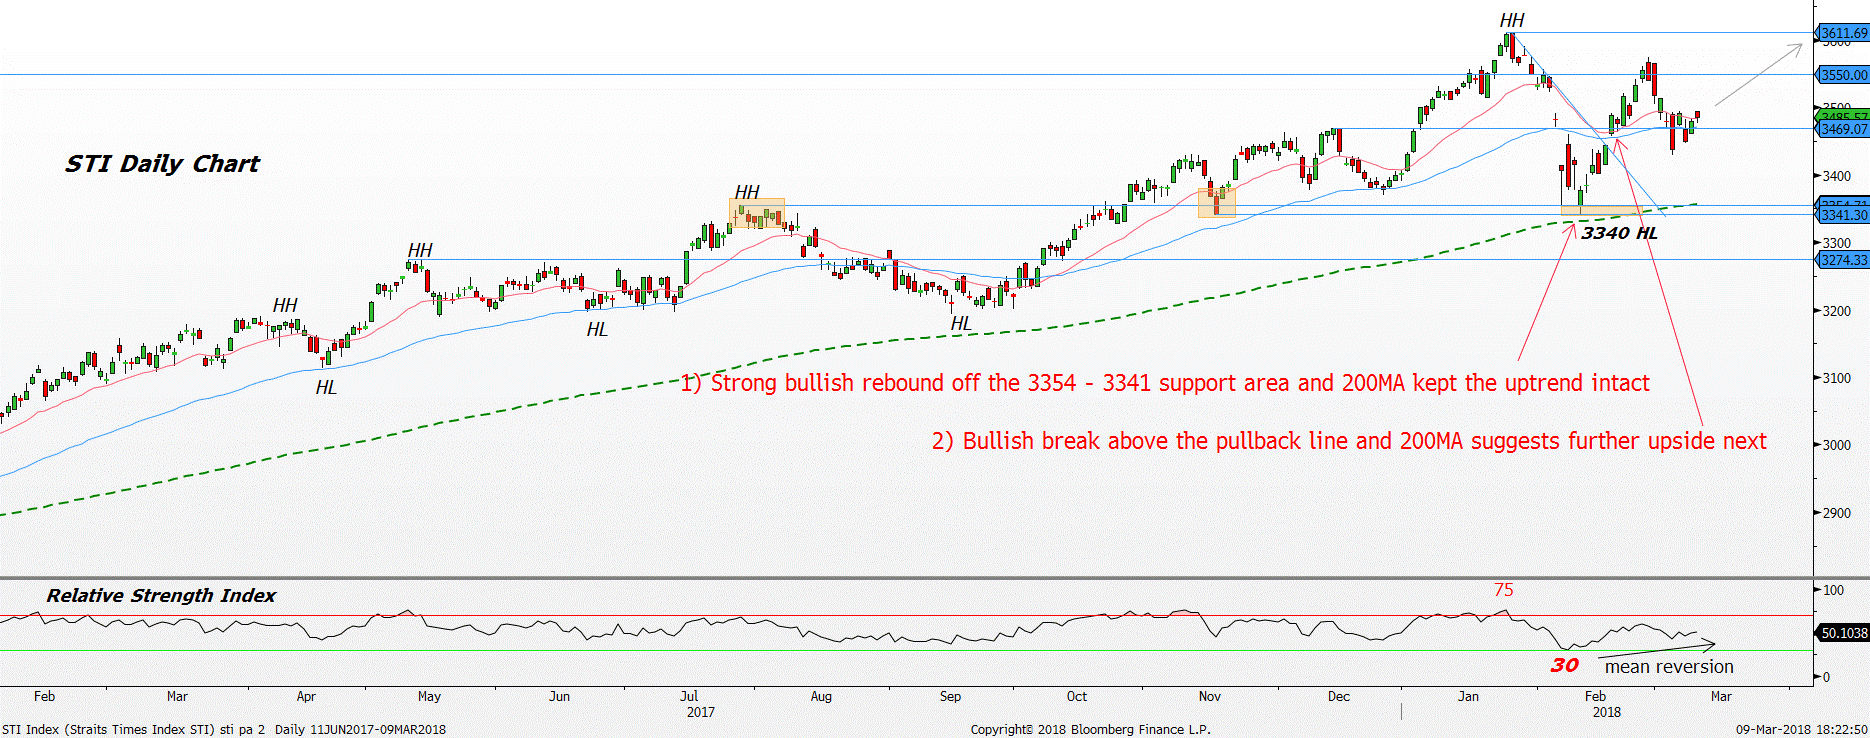
Moreover, the bullish recovery since 9 February has also lifted price back above the 20 and 60 day moving average signals the bullish momentum has returned. Moving forward, expect the uptrend to spur the STI higher to retest the 3600 psychological round number followed by 3650. We should continue to see the 20 and 60 day moving average propelling price higher as the market volatility stabilises.
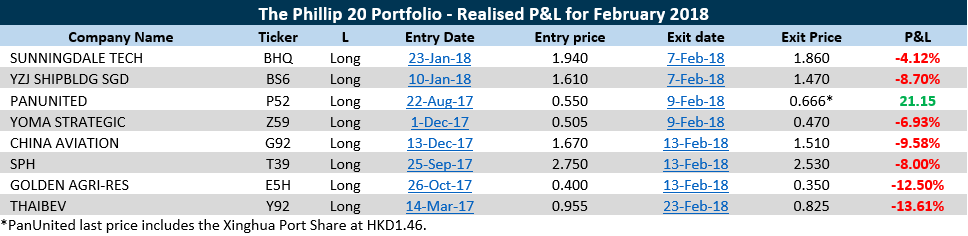
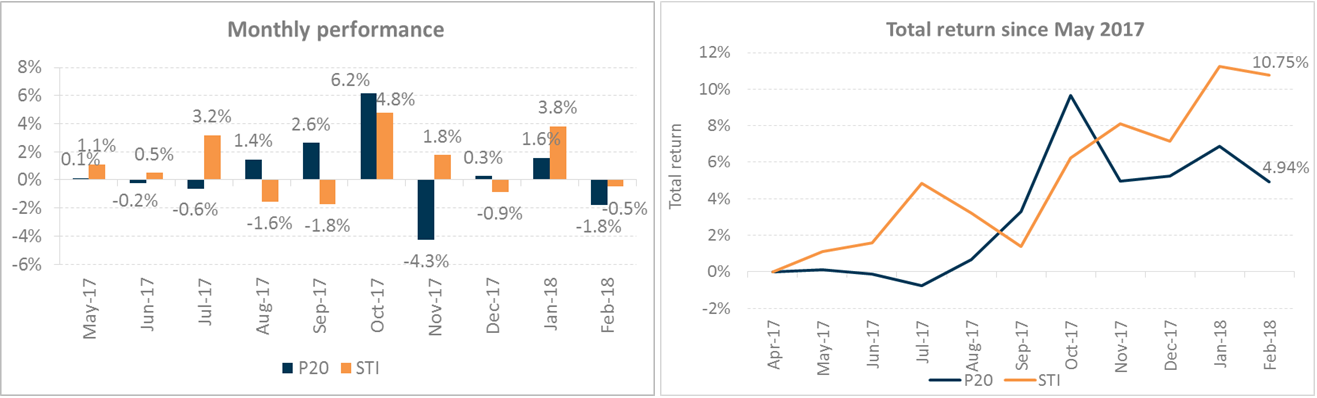
As a result of the sharp selloff in the STI, the “Phillip 20 Portfolio” was adversely affected by the risk-off sentiment. The “Phillip 20 Portfolio” suffered losses of -1.81% in February. On the other hand, STI was down -0.45% in February.
|
Winners PanUnited was closed out on 9 February at 0.420 as mentioned in the previous monthly update. As a result, this trade contributed 1.06% to the “Phillip 20 Portfolio” after factoring in the Xinghua Port share. Losers Seven positions in the “Phillip 20 Portfolio “triggered their stop losses namely, YZJ Shipbldg SGD, Sunningdale Tech, Yoma Strategic, China Aviation, SPH, Golden Agri-Res and Thaibev. |
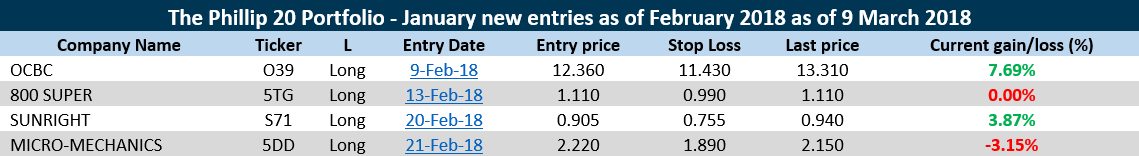
New Entries
The following table is the list of new trades were added into the “Phillip 20 Portfolio” in February.
|
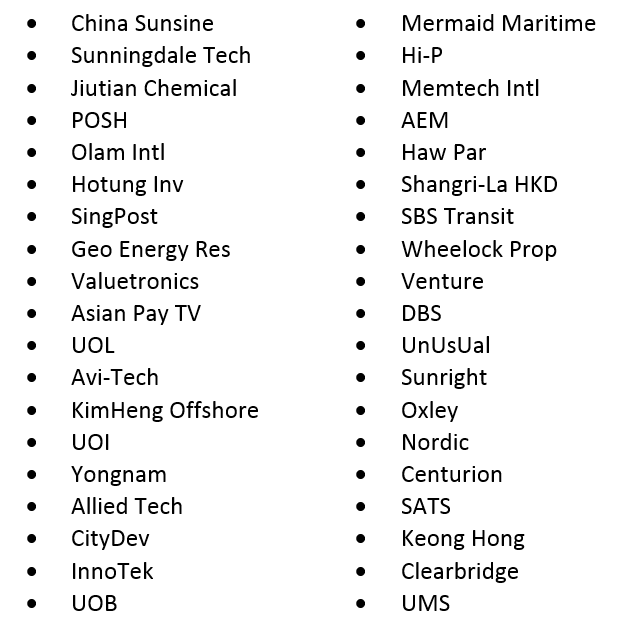
Watchlist After a major reshuffling of the portfolio, there are currently 16 stocks within the “Phillip 20 Portfolio.” The following is the revised watch list that we are closely monitoring: |
Important Information
This report is prepared and/or distributed by Phillip Securities Research Pte Ltd ("Phillip Securities Research"), which is a holder of a financial adviser’s licence under the Financial Advisers Act, Chapter 110 in Singapore.
By receiving or reading this report, you agree to be bound by the terms and limitations set out below. Any failure to comply with these terms and limitations may constitute a violation of law. This report has been provided to you for personal use only and shall not be reproduced, distributed or published by you in whole or in part, for any purpose. If you have received this report by mistake, please delete or destroy it, and notify the sender immediately.
The information and any analysis, forecasts, projections, expectations and opinions (collectively, the “Research”) contained in this report has been obtained from public sources which Phillip Securities Research believes to be reliable. However, Phillip Securities Research does not make any representation or warranty, express or implied that such information or Research is accurate, complete or appropriate or should be relied upon as such. Any such information or Research contained in this report is subject to change, and Phillip Securities Research shall not have any responsibility to maintain or update the information or Research made available or to supply any corrections, updates or releases in connection therewith.
Any opinions, forecasts, assumptions, estimates, valuations and prices contained in this report are as of the date indicated and are subject to change at any time without prior notice. Past performance of any product referred to in this report is not indicative of future results.
This report does not constitute, and should not be used as a substitute for, tax, legal or investment advice. This report should not be relied upon exclusively or as authoritative, without further being subject to the recipient’s own independent verification and exercise of judgment. The fact that this report has been made available constitutes neither a recommendation to enter into a particular transaction, nor a representation that any product described in this report is suitable or appropriate for the recipient. Recipients should be aware that many of the products, which may be described in this report involve significant risks and may not be suitable for all investors, and that any decision to enter into transactions involving such products should not be made, unless all such risks are understood and an independent determination has been made that such transactions would be appropriate. Any discussion of the risks contained herein with respect to any product should not be considered to be a disclosure of all risks or a complete discussion of such risks.
Nothing in this report shall be construed to be an offer or solicitation for the purchase or sale of any product. Any decision to purchase any product mentioned in this report should take into account existing public information, including any registered prospectus in respect of such product.
Phillip Securities Research, or persons associated with or connected to Phillip Securities Research, including but not limited to its officers, directors, employees or persons involved in the issuance of this report, may provide an array of financial services to a large number of corporations in Singapore and worldwide, including but not limited to commercial / investment banking activities (including sponsorship, financial advisory or underwriting activities), brokerage or securities trading activities. Phillip Securities Research, or persons associated with or connected to Phillip Securities Research, including but not limited to its officers, directors, employees or persons involved in the issuance of this report, may have participated in or invested in transactions with the issuer(s) of the securities mentioned in this report, and may have performed services for or solicited business from such issuers. Additionally, Phillip Securities Research, or persons associated with or connected to Phillip Securities Research, including but not limited to its officers, directors, employees or persons involved in the issuance of this report, may have provided advice or investment services to such companies and investments or related investments, as may be mentioned in this report.
Phillip Securities Research or persons associated with or connected to Phillip Securities Research, including but not limited to its officers, directors, employees or persons involved in the issuance of this report may, from time to time maintain a long or short position in securities referred to herein, or in related futures or options, purchase or sell, make a market in, or engage in any other transaction involving such securities, and earn brokerage or other compensation in respect of the foregoing. Investments will be denominated in various currencies including US dollars and Euro and thus will be subject to any fluctuation in exchange rates between US dollars and Euro or foreign currencies and the currency of your own jurisdiction. Such fluctuations may have an adverse effect on the value, price or income return of the investment.
To the extent permitted by law, Phillip Securities Research, or persons associated with or connected to Phillip Securities Research, including but not limited to its officers, directors, employees or persons involved in the issuance of this report, may at any time engage in any of the above activities as set out above or otherwise hold an interest, whether material or not, in respect of companies and investments or related investments, which may be mentioned in this report. Accordingly, information may be available to Phillip Securities Research, or persons associated with or connected to Phillip Securities Research, including but not limited to its officers, directors, employees or persons involved in the issuance of this report, which is not reflected in this report, and Phillip Securities Research, or persons associated with or connected to Phillip Securities Research, including but not limited to its officers, directors, employees or persons involved in the issuance of this report, may, to the extent permitted by law, have acted upon or used the information prior to or immediately following its publication. Phillip Securities Research, or persons associated with or connected to Phillip Securities Research, including but not limited its officers, directors, employees or persons involved in the issuance of this report, may have issued other material that is inconsistent with, or reach different conclusions from, the contents of this report.
The information, tools and material presented herein are not directed, intended for distribution to or use by, any person or entity in any jurisdiction or country where such distribution, publication, availability or use would be contrary to the applicable law or regulation or which would subject Phillip Securities Research to any registration or licensing or other requirement, or penalty for contravention of such requirements within such jurisdiction.
This report is intended for general circulation only and does not take into account the specific investment objectives, financial situation or particular needs of any particular person. The products mentioned in this report may not be suitable for all investors and a person receiving or reading this report should seek advice from a professional and financial adviser regarding the legal, business, financial, tax and other aspects including the suitability of such products, taking into account the specific investment objectives, financial situation or particular needs of that person, before making a commitment to invest in any of such products.
This report is not intended for distribution, publication to or use by any person in any jurisdiction outside of Singapore or any other jurisdiction as Phillip Securities Research may determine in its absolute discretion.
IMPORTANT DISCLOSURES FOR INCLUDED RESEARCH ANALYSES OR REPORTS OF FOREIGN RESEARCH HOUSE
Where the report contains research analyses or reports from a foreign research house, please note:

Jeremy specialises in Technical Analysis and has 10 years of experience in studying price action. His areas of expertise include intermarket analysis on the equities, currencies, commodities and bonds market.
He is also a regular columnist on The Business Times - every Monday ChartPoint column.
He graduated with a Bachelor of Science in Banking and Finance from University of London.
