
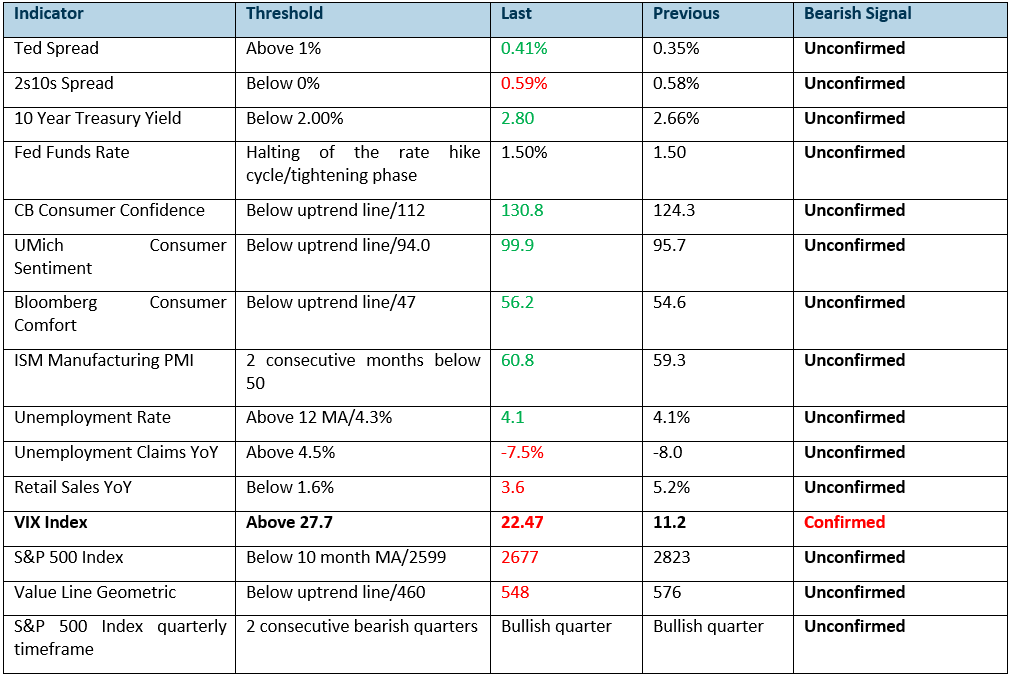
February was a crazy month where massive volatility was unleashed. With the volatility explosion incident behind us, does that signal the end of this bull market? Our “Phillip Recession Tracker” suggests otherwise where all the indicators are well in the healthy range except for the VIX Index. Overall, the general economic health of US continued to improve in February with no major sign of deterioration.
Figure 1: Phillip Recession Tracker – all remains well
5 February 2018 was the day when the VIX index exploded uncontrollably as it rose 161% from 17.16 to 37.32. This sharp spike was not a complete surprise considering how the market was so extremely positioned on the short volatility trade. The CFTC CBOE VIX Futures Non-Commercial Short Contracts were at a record high of 345,000 contracts, and it stayed extremely short since July 2017. A short squeeze of epic proportion was imminent which eventually happened in early February.
Moreover, some crack signs appeared before the 5 February VIX explosion day. During the last week of January, the VIX index spiked up 39% while the S&P 500 index only experienced a -2% drawdown highlighting something was amiss.
The market only calmed down one day later after the VIX index hit a high of 50.30 on 6 February. As a result, the erratic movements in the VIX index triggered our threshold as it breached above the 27 upper range. Nevertheless, this is only the first warning signal for a more turbulent market ahead. Historically, the S&P 500 index does not top out immediately when the VIX index triggers the upper threshold (27). Instead, we need to see the VIX index going through a period of normalisation first where the VIX index builds a new floor at around the 16.00 level. Once a higher new floor above the complacent 10 floor is achieved, that will signal that the market dynamics have changed to a more fearful tone. Subsequent spikes above the 30 range will signal further flaws and vulnerability in the market.
Figure 2: VIX Index – spiking above the 27.7 upper range
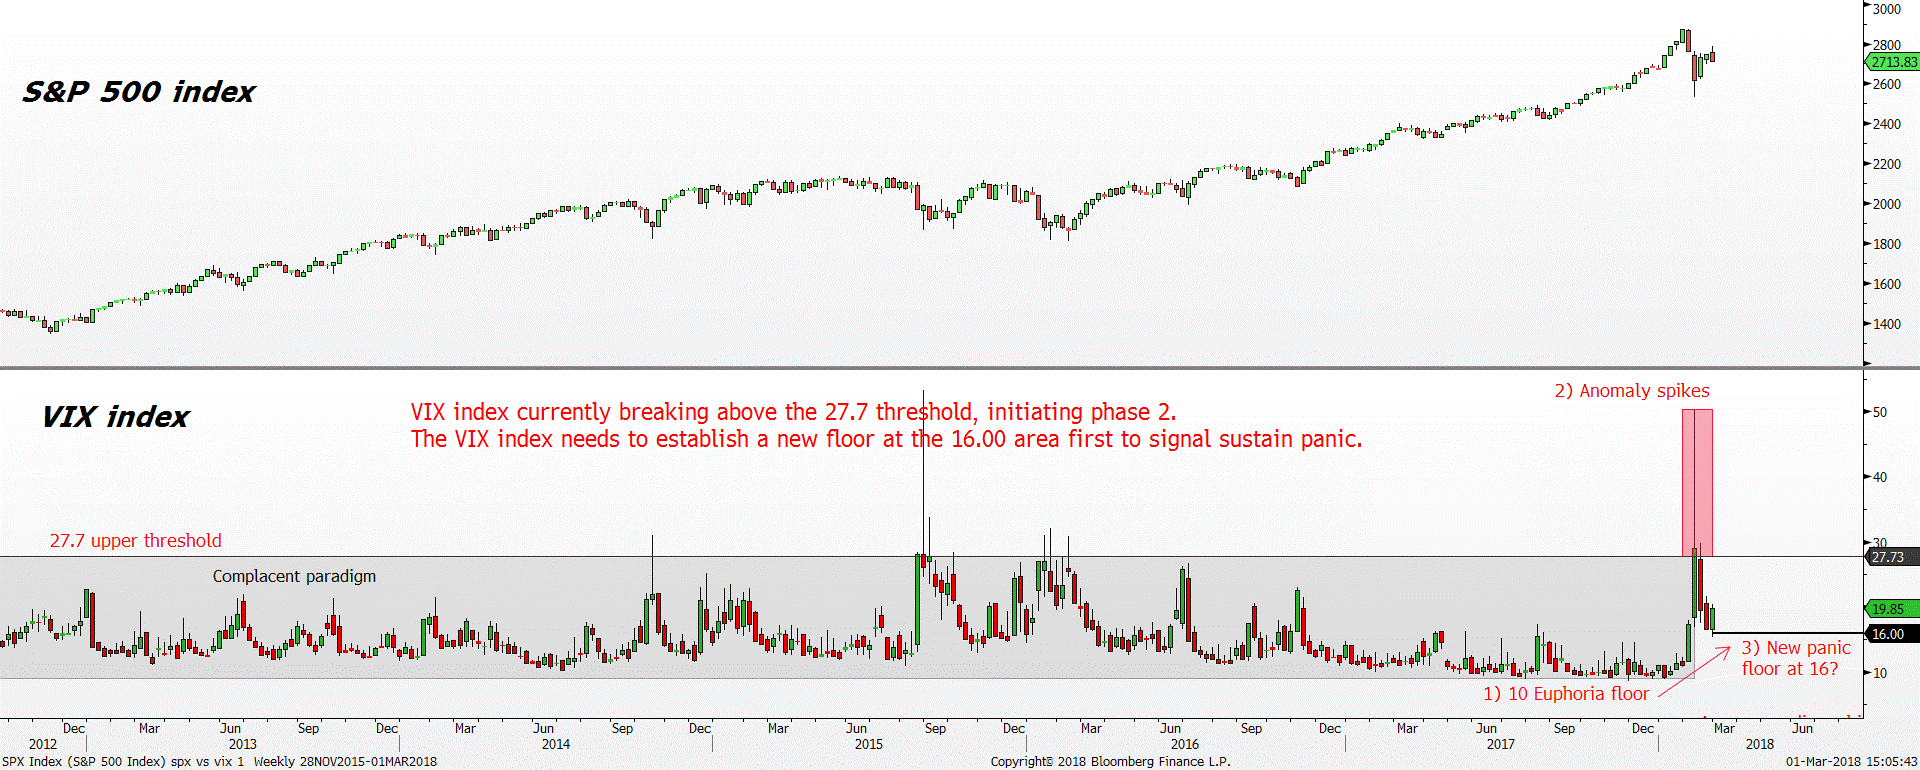
All should remain well until we see further spikes in the VIX index above the 30 range again. In other words, the general equity market should continue to move in the upward trajectory.
Sentiment
The general sentiment of the consumer remains on a euphoria mode despite the Volatility shock. The Bloomberg Consumer Comfort index managed to capture three weeks’ worth of data after the Volatility explosion incident and the consumer sentiment seemed unaffected by it. It continued to linger near the 2001 high at 56.2.
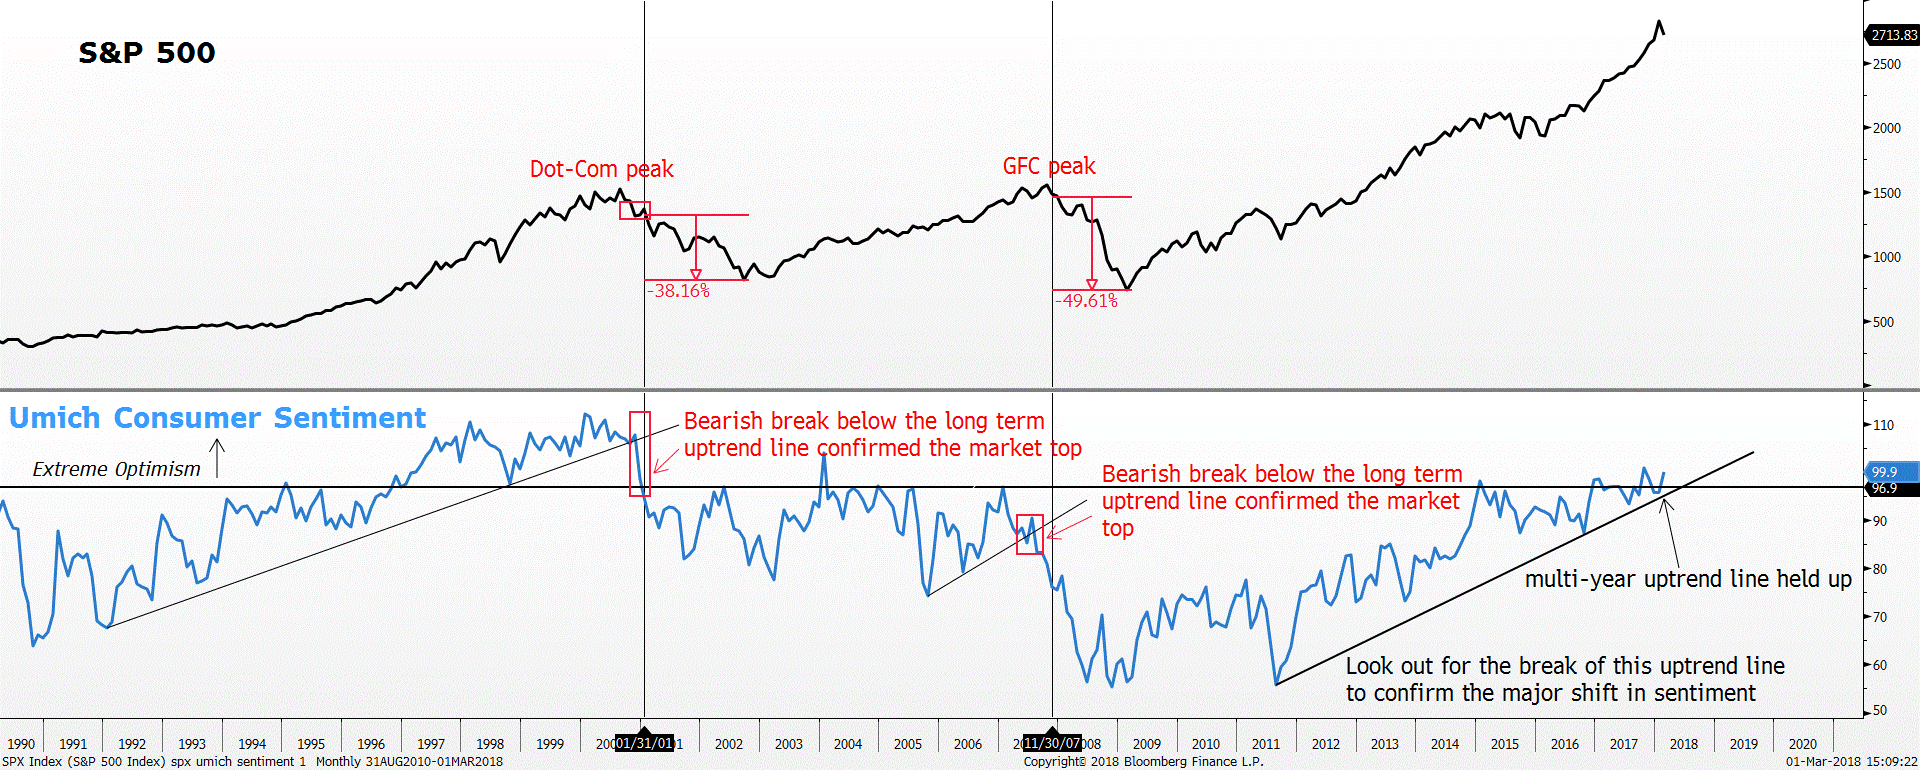
The other two measures of consumer confidence from Conference Board and the University of Michigan showed further improvement in February, highest since 2000 and 2001 respectively. More importantly, as highlighted in the January update, the Umich Consumer Sentiment has rebounded off the key uptrend line threshold and improved to a high of 99.9.
Figure 3: Umich Consumer Sentiment – rebounding off the critical threshold
On the manufacturing front, the ISM Manufacturing PMI improved further to 60.8, the highest level since June 2004. The current level of the PMI remains solid, similar to what the consumer sentiments are displaying.
Interest rate related data
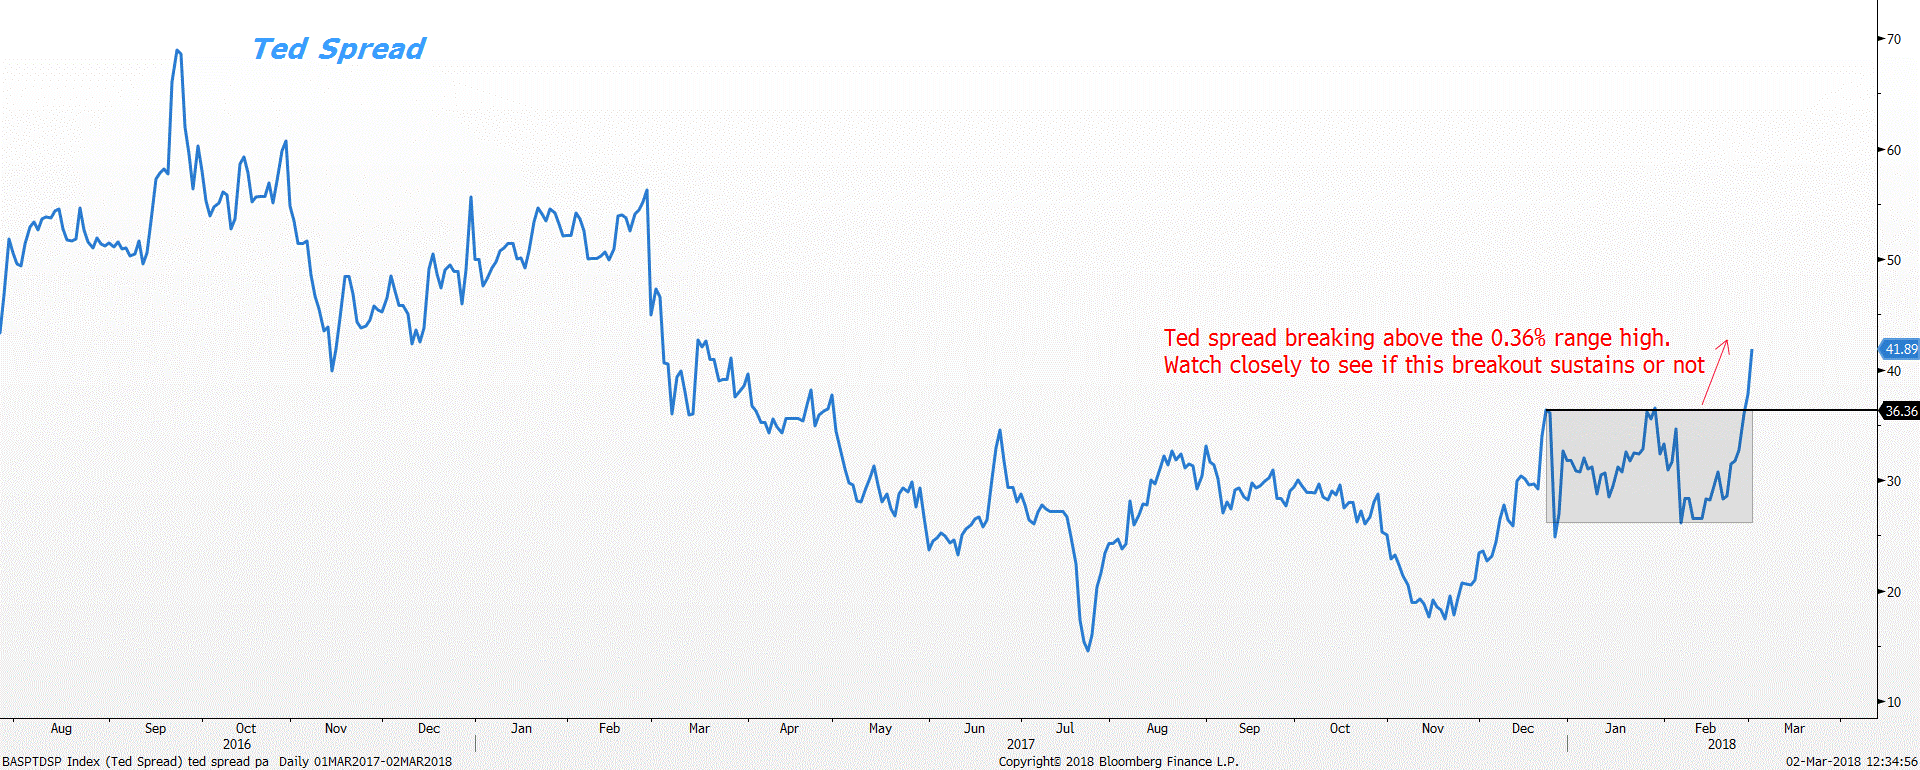
The interbank market started to react to the Volatility shock as the Ted Spread recently crept higher and broke a new 52-week high at 0.41%. Watch this space closely to see if this recent breakout sustains or not. Keep in mind the key threshold to watch for the Ted spread to signal a bear market is the 1% level.
Note: Rising Ted Spread signals increasing stress in the interbank market.
Figure 4: Ted Spread – breaking above the three months range
The 2s10s spread steepened in February, moving further away from the 0% danger zone. This steepening is in line with the expectations of a rate hike in March where the market is already pricing in 100% probability of a rate hike based on the Fed Fund Futures. However, keep in mind that the overall long-term trend in the 2s10s spread is still down. Our base case scenario still points to at least 6 to 8 more months of further flattening before the yield curve inverts.
Important Information
This report is prepared and/or distributed by Phillip Securities Research Pte Ltd ("Phillip Securities Research"), which is a holder of a financial adviser’s licence under the Financial Advisers Act, Chapter 110 in Singapore.
By receiving or reading this report, you agree to be bound by the terms and limitations set out below. Any failure to comply with these terms and limitations may constitute a violation of law. This report has been provided to you for personal use only and shall not be reproduced, distributed or published by you in whole or in part, for any purpose. If you have received this report by mistake, please delete or destroy it, and notify the sender immediately.
The information and any analysis, forecasts, projections, expectations and opinions (collectively, the “Research”) contained in this report has been obtained from public sources which Phillip Securities Research believes to be reliable. However, Phillip Securities Research does not make any representation or warranty, express or implied that such information or Research is accurate, complete or appropriate or should be relied upon as such. Any such information or Research contained in this report is subject to change, and Phillip Securities Research shall not have any responsibility to maintain or update the information or Research made available or to supply any corrections, updates or releases in connection therewith.
Any opinions, forecasts, assumptions, estimates, valuations and prices contained in this report are as of the date indicated and are subject to change at any time without prior notice. Past performance of any product referred to in this report is not indicative of future results.
This report does not constitute, and should not be used as a substitute for, tax, legal or investment advice. This report should not be relied upon exclusively or as authoritative, without further being subject to the recipient’s own independent verification and exercise of judgment. The fact that this report has been made available constitutes neither a recommendation to enter into a particular transaction, nor a representation that any product described in this report is suitable or appropriate for the recipient. Recipients should be aware that many of the products, which may be described in this report involve significant risks and may not be suitable for all investors, and that any decision to enter into transactions involving such products should not be made, unless all such risks are understood and an independent determination has been made that such transactions would be appropriate. Any discussion of the risks contained herein with respect to any product should not be considered to be a disclosure of all risks or a complete discussion of such risks.
Nothing in this report shall be construed to be an offer or solicitation for the purchase or sale of any product. Any decision to purchase any product mentioned in this report should take into account existing public information, including any registered prospectus in respect of such product.
Phillip Securities Research, or persons associated with or connected to Phillip Securities Research, including but not limited to its officers, directors, employees or persons involved in the issuance of this report, may provide an array of financial services to a large number of corporations in Singapore and worldwide, including but not limited to commercial / investment banking activities (including sponsorship, financial advisory or underwriting activities), brokerage or securities trading activities. Phillip Securities Research, or persons associated with or connected to Phillip Securities Research, including but not limited to its officers, directors, employees or persons involved in the issuance of this report, may have participated in or invested in transactions with the issuer(s) of the securities mentioned in this report, and may have performed services for or solicited business from such issuers. Additionally, Phillip Securities Research, or persons associated with or connected to Phillip Securities Research, including but not limited to its officers, directors, employees or persons involved in the issuance of this report, may have provided advice or investment services to such companies and investments or related investments, as may be mentioned in this report.
Phillip Securities Research or persons associated with or connected to Phillip Securities Research, including but not limited to its officers, directors, employees or persons involved in the issuance of this report may, from time to time maintain a long or short position in securities referred to herein, or in related futures or options, purchase or sell, make a market in, or engage in any other transaction involving such securities, and earn brokerage or other compensation in respect of the foregoing. Investments will be denominated in various currencies including US dollars and Euro and thus will be subject to any fluctuation in exchange rates between US dollars and Euro or foreign currencies and the currency of your own jurisdiction. Such fluctuations may have an adverse effect on the value, price or income return of the investment.
To the extent permitted by law, Phillip Securities Research, or persons associated with or connected to Phillip Securities Research, including but not limited to its officers, directors, employees or persons involved in the issuance of this report, may at any time engage in any of the above activities as set out above or otherwise hold an interest, whether material or not, in respect of companies and investments or related investments, which may be mentioned in this report. Accordingly, information may be available to Phillip Securities Research, or persons associated with or connected to Phillip Securities Research, including but not limited to its officers, directors, employees or persons involved in the issuance of this report, which is not reflected in this report, and Phillip Securities Research, or persons associated with or connected to Phillip Securities Research, including but not limited to its officers, directors, employees or persons involved in the issuance of this report, may, to the extent permitted by law, have acted upon or used the information prior to or immediately following its publication. Phillip Securities Research, or persons associated with or connected to Phillip Securities Research, including but not limited its officers, directors, employees or persons involved in the issuance of this report, may have issued other material that is inconsistent with, or reach different conclusions from, the contents of this report.
The information, tools and material presented herein are not directed, intended for distribution to or use by, any person or entity in any jurisdiction or country where such distribution, publication, availability or use would be contrary to the applicable law or regulation or which would subject Phillip Securities Research to any registration or licensing or other requirement, or penalty for contravention of such requirements within such jurisdiction.
This report is intended for general circulation only and does not take into account the specific investment objectives, financial situation or particular needs of any particular person. The products mentioned in this report may not be suitable for all investors and a person receiving or reading this report should seek advice from a professional and financial adviser regarding the legal, business, financial, tax and other aspects including the suitability of such products, taking into account the specific investment objectives, financial situation or particular needs of that person, before making a commitment to invest in any of such products.
This report is not intended for distribution, publication to or use by any person in any jurisdiction outside of Singapore or any other jurisdiction as Phillip Securities Research may determine in its absolute discretion.
IMPORTANT DISCLOSURES FOR INCLUDED RESEARCH ANALYSES OR REPORTS OF FOREIGN RESEARCH HOUSE
Where the report contains research analyses or reports from a foreign research house, please note:

Jeremy specialises in Technical Analysis and has 10 years of experience in studying price action. His areas of expertise include intermarket analysis on the equities, currencies, commodities and bonds market.
He is also a regular columnist on The Business Times - every Monday ChartPoint column.
He graduated with a Bachelor of Science in Banking and Finance from University of London.
