
The general equity market continues to vault higher with the S&P 500 Index breaking new record higher day after day. It has only been four weeks into 2018 and the S&P 500 index is already up 6%. A major catalyst for the bullish move was the passing of the tax cut bill in December. Some firms such as Wal-Mar, Comcast, Bank of America, JP Morgan Chase & Co, Starbucks and Disney already have plans to increase wages, issue one-off bonus and hire more workers in response to the tax overhaul.
Figure 1: Phillip Recession Tracker – all remains well
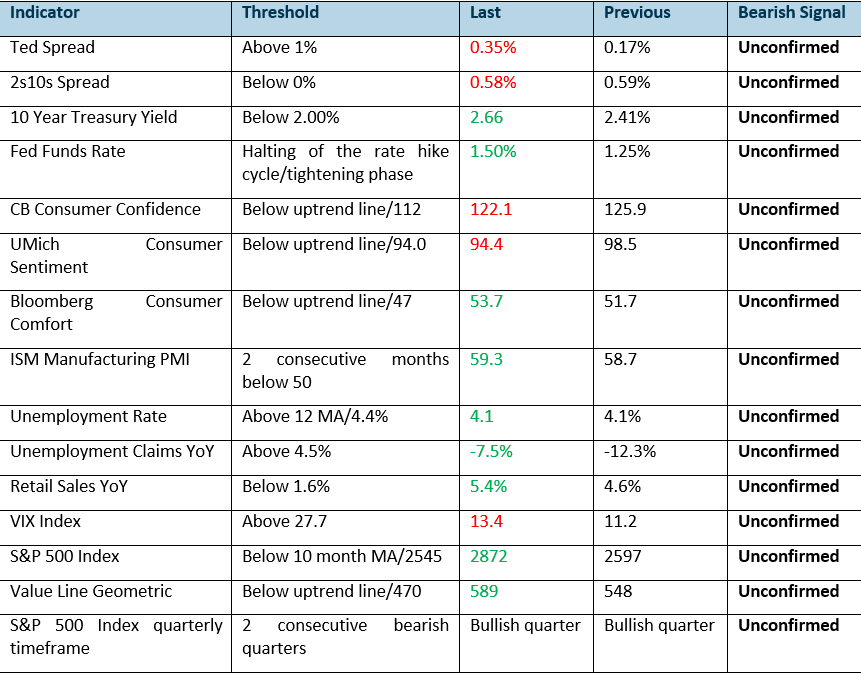
Our Phillip recession tracker is based on 15 fundamental and technical indicators. The threshold represents the levels where bearish signal arises.
Red/Green represents deterioration/improvement from the prior month. Otherwise, it is unchanged.
All clear for now
All clear for now part 2
Likewise, the Phillip Recession Tracker is still showing further improvement, validating the bullish move in the equity market. Most of the recession indicators are still a far cry away from their respective threshold that will trigger the bearish signal, and our base case scenario for seeing some form of significant weakness is at least 6 – 8 months away. For more information on how we decipher the recession tracker indicators, refer to the report “all clear for now.”
Consumer Sentiment
The general sentiment is still at a high with the Bloomberg Consumer Comfort reaching a new multi-week high at 53.8, last seen in March 2001. CB Consumer Confidence also echoed the feel-good effect as it improved in both November and December 2017 to 122.1.
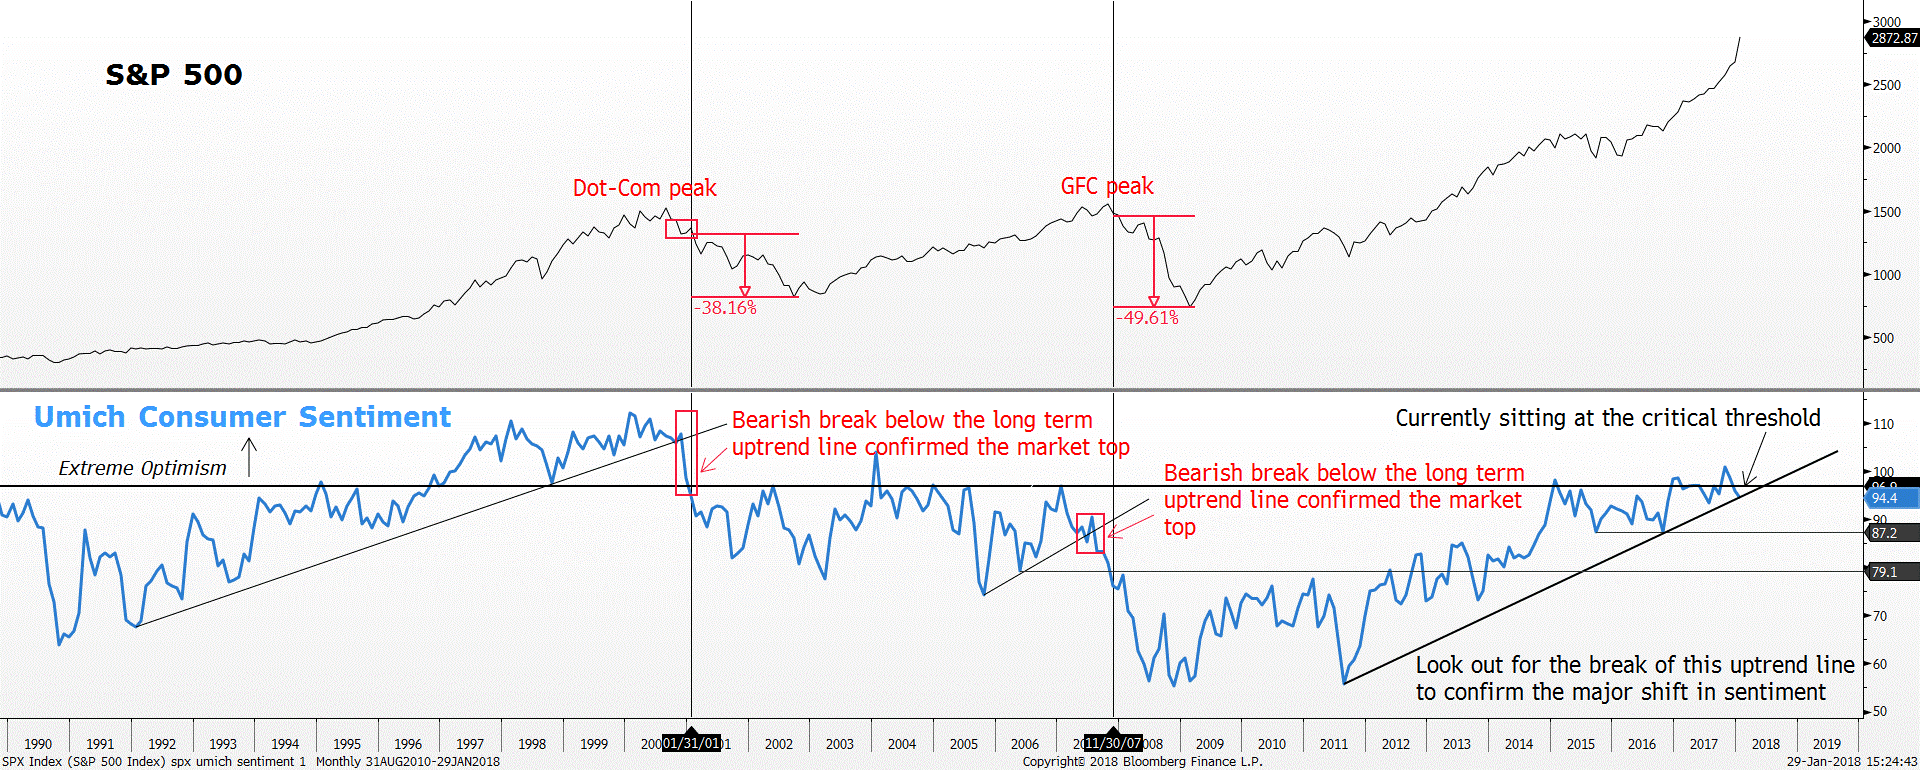
The only outlier in the consumer sentiment space is the Umich Consumer sentiment where it fell consecutively in both November and December from 100.7 to 96.9. Nonetheless, it is still at the euphoric high level. It is currently near the threshold of 94.0 and it is the only recession indicator that is near the threshold. Watch the development of the Umich Consumer sentiment to see if this fall is just a blip or the start of something worrying. As long as the other two consumer sentiment gauge is improving, the overall mood and performance of the equity market should continue to perform fine.
Figure 2: Umich Consumer Sentiment – sitting at the critical threshold
On the industrial side, the ISM manufacturing PMI continues to expand at a strong pace with the recent reading at 59.7, hovering above the euphoric high. All seems fine from the sentiment perspective.
Retail Sales
Retail Sales YoY growth fell marginally in December as it declined from a high of 6.0 to 5.4. Nonetheless, the general growth trend remains strong on the upside.
The key threshold to watch for the retail sales space is the 1.6% level. A reading below the 1.6% level will signal a great deal of weakness.
Interest rate related data
Nothing alarming here from the interest rate complex as the Ted Spread remained tame. Ted spread pretty much ranged sideways for the past month between 0.33% and 0.25%, signalling calmness. Panic will surface once the Ted Spread begins spiking violently above the 0.60% threshold. Until then, the general equity market should progress higher.
On the other hand, the 2s10s spread (yield curve) flattened to a new 52-week low of 0.48% in January 2018 causing some scare to the market. Nonetheless, our base case projection suggests at least another 6 to 8 more months of further flattening in the 2s10s spread before the spread falls below the danger zone of 0%, signalling inversion of the yield curve. Put differently; the general equity market should still have 6 – 8 more months of upside left in them before it experiences any form of significant pullback.
Looking at where we are currently, the 2s10s spread has also recovered back above the 0.50% psychological level, currently at 0.58%.
Taking a deeper look at the 2s10s spread shows the possible timeline for the next recession. There seemed to be a strong negative correlation between the 2s10s spread and the Fed Funds Rate (FFR) where the prolonged rate hike cycle leads to the flattening of the 2s10s spread and ultimately the inversion of the yield curve.
For instance, the rate hike cycle in the housing boom period of the 2000s. The FED began the rate hike cycle only in July 2004 where the FFR was lifted from 1% to 1.25%. At the same time, the 2s10s spread was still trading at a high of 1.92%. Subsequent rate hikes to 4.25% in the following 17 months finally dragged the 2s10s spread into negative territory in December 2005. The FED only realised the problem with the negative 2s10s spread six months later in June 2006 where they were forced to halt the rate hike cycle at a high of 5.25%. The halting of the rate hike cycle also signalled to the market that something was amiss. Ultimately, the market fell sharply in the latter part of 2007 as recession ensued in December 2007. Both the inversion of the 2s10s spread and the subsequent halting of the rate hike cycle provided ample warning of a major market downturn. Historically, this pattern has played out perfectly since the 1970s where:
Figure 3: 2s10s spread – requires at least another 33 weeks before the inversion of the yield curve happens
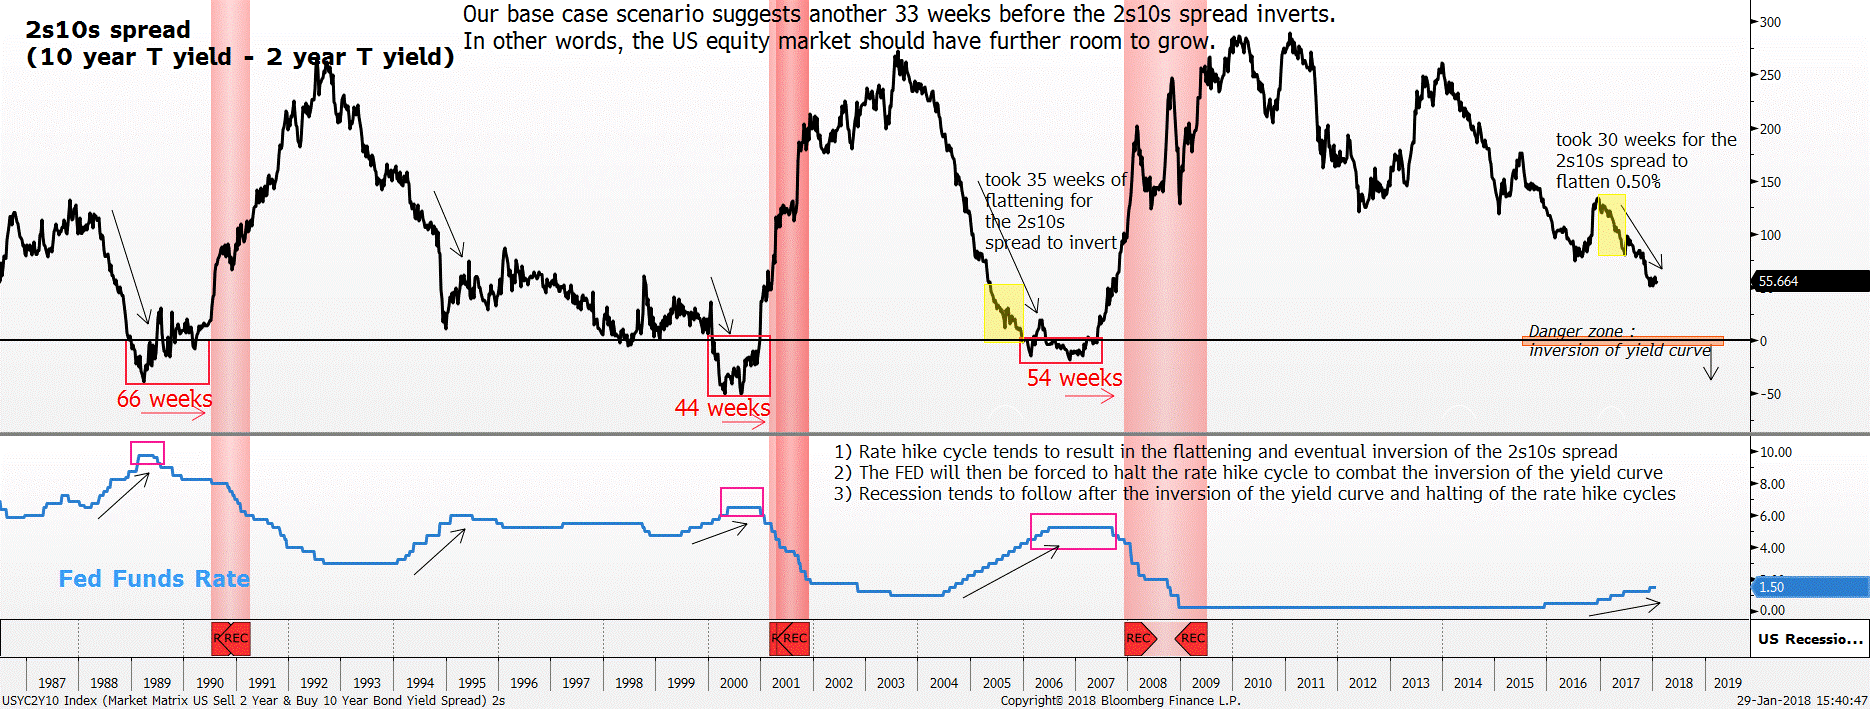
Hence, with the expectations of at least three more rate hikes in 2018, we can conclude that the 2s10s spread would continue to follow the flattening trajectory. Referencing the data back in 2005 where the 2s10s spread was also trading at the current 0.55%, extrapolating the pace of the decline suggests 35 weeks before the 2s10s spread drops below the danger zone of 0%. Alternatively, using the recent flattening data in late 2016 and early 2017 suggests a similar timeframe for the inversion of the 2s10s spread. Back in December 2016, the 2s10s spread was trading at 1.33%. It took the market 30 weeks for the 2s10s spread to flatten 0.50% shown by the yellow highlighted box.
Bear in mind even if the 2s10s spread falls into negative territory, the fall out in the market will not be immediate. On average, the recession occurs with a lag time of 54 weeks after the inversion of the yield curve. Thus, based on the recent flattening of the 2s10s spread, the base case scenario points to at least 6-8 more months of flattening before the 2s10s spread falls into the danger zone. In other words, the general equity market still has 6-8 more months of upside left before seeing some sharper corrections.
10 year-treasury yield
With much expectations baked into having another 0.25% interest rate hike in March, the 10-year treasury yield staged a strong move higher. Based on the Futures and Options market, the implied probability of a rate hike in March 2018 is currently at 91% making a 0.25% rate hike in March almost a certainty. Hence, justifying for the move higher in the 10-year treasury yield. The 10-year treasury is currently at three years high of 2.71%. Keep in mind the threshold for the 10-year treasury yield to signal weakness is the 2.00% mark.
Fed Funds Rate
The Federal Reserve (FED) appears to stay on track to their rate hike cycle. According to the FED’s Dot-Plot projection, three more rate hikes of 0.25% is expected in 2018. The market is currently pricing in a 0.25% rate hike in March 2018 as suggested by the Futures and Options market. As long as the FED continues with the rate hike trajectory, that will signal further vote of confidence to the market. The general equity market should continue to rise along with it.
The most important thing to look for is if the FED suddenly switches to a dovish stance and halts the rate hike cycle. That will be the first red flag. Ultimately, the next rate cut would most probably drive the market down along with it.
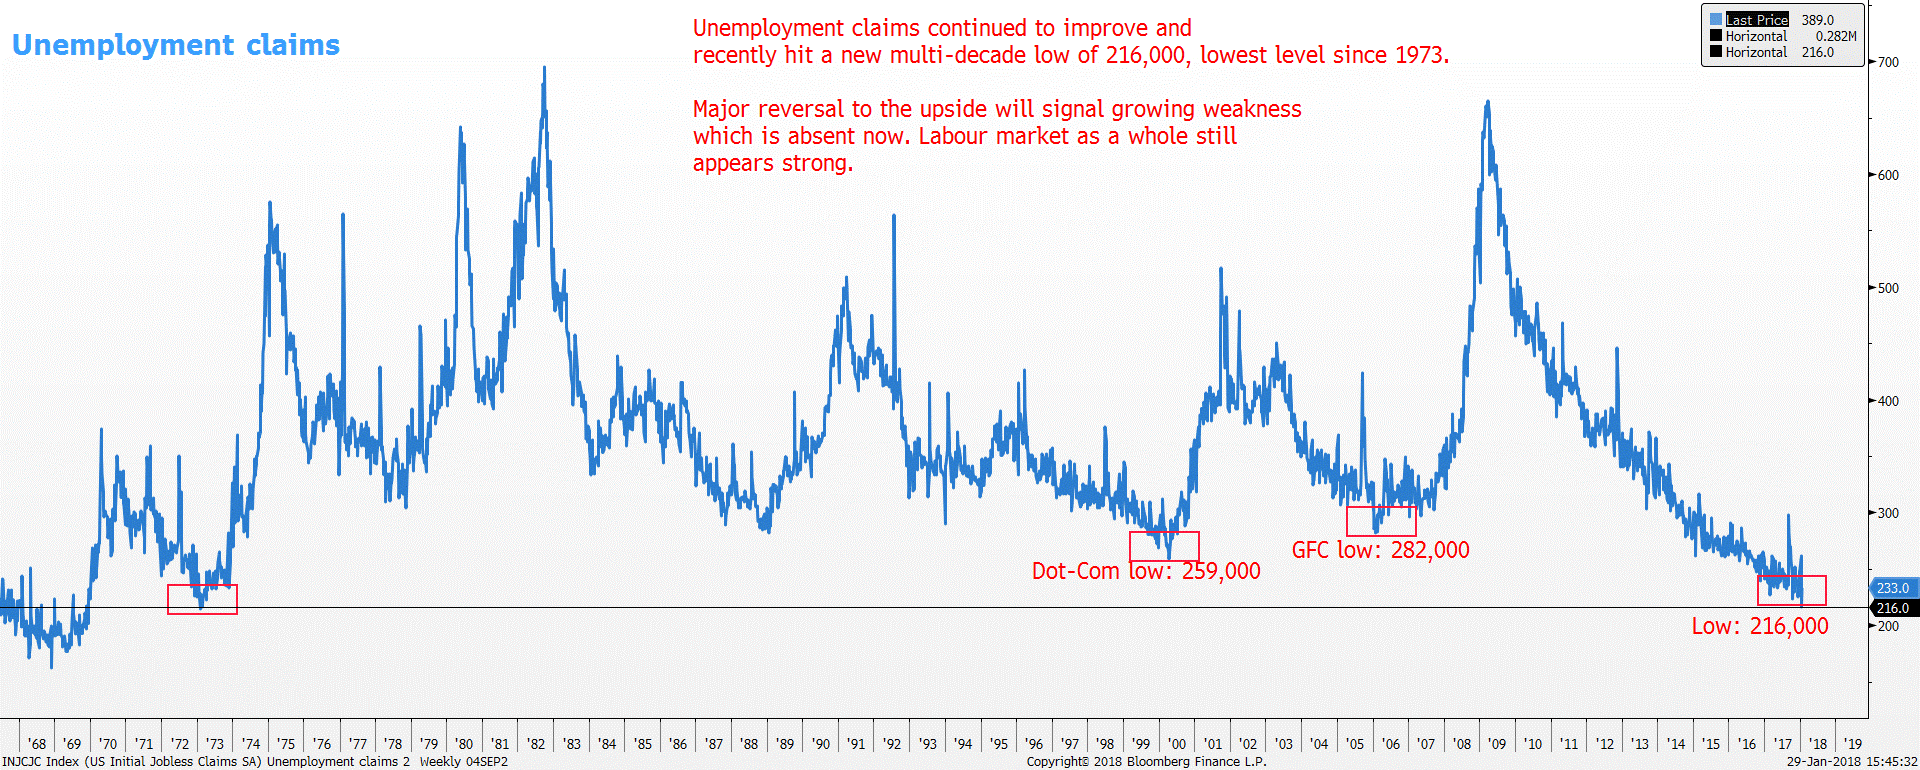
Employment data
Both the unemployment rate and initial jobless claims remained at their multi-decade lows justifying the strong growth. The unemployment rate is at 4.1%, which is the lowest since 2001 while initial jobless claims index is at the lowest since 1973 at 222,000 new weekly claims. Our preferred measure of initial jobless claims on the year-on-year (YoY) perspective has also improved to -8.7%, way away from the threshold of 4.5%. Overall, unemployment numbers continue to suggest healthy jobs dynamic.
Figure 4: Weekly Unemployment Claims – lowest in 44 years
Important Information
This report is prepared and/or distributed by Phillip Securities Research Pte Ltd ("Phillip Securities Research"), which is a holder of a financial adviser’s licence under the Financial Advisers Act, Chapter 110 in Singapore.
By receiving or reading this report, you agree to be bound by the terms and limitations set out below. Any failure to comply with these terms and limitations may constitute a violation of law. This report has been provided to you for personal use only and shall not be reproduced, distributed or published by you in whole or in part, for any purpose. If you have received this report by mistake, please delete or destroy it, and notify the sender immediately.
The information and any analysis, forecasts, projections, expectations and opinions (collectively, the “Research”) contained in this report has been obtained from public sources which Phillip Securities Research believes to be reliable. However, Phillip Securities Research does not make any representation or warranty, express or implied that such information or Research is accurate, complete or appropriate or should be relied upon as such. Any such information or Research contained in this report is subject to change, and Phillip Securities Research shall not have any responsibility to maintain or update the information or Research made available or to supply any corrections, updates or releases in connection therewith.
Any opinions, forecasts, assumptions, estimates, valuations and prices contained in this report are as of the date indicated and are subject to change at any time without prior notice. Past performance of any product referred to in this report is not indicative of future results.
This report does not constitute, and should not be used as a substitute for, tax, legal or investment advice. This report should not be relied upon exclusively or as authoritative, without further being subject to the recipient’s own independent verification and exercise of judgment. The fact that this report has been made available constitutes neither a recommendation to enter into a particular transaction, nor a representation that any product described in this report is suitable or appropriate for the recipient. Recipients should be aware that many of the products, which may be described in this report involve significant risks and may not be suitable for all investors, and that any decision to enter into transactions involving such products should not be made, unless all such risks are understood and an independent determination has been made that such transactions would be appropriate. Any discussion of the risks contained herein with respect to any product should not be considered to be a disclosure of all risks or a complete discussion of such risks.
Nothing in this report shall be construed to be an offer or solicitation for the purchase or sale of any product. Any decision to purchase any product mentioned in this report should take into account existing public information, including any registered prospectus in respect of such product.
Phillip Securities Research, or persons associated with or connected to Phillip Securities Research, including but not limited to its officers, directors, employees or persons involved in the issuance of this report, may provide an array of financial services to a large number of corporations in Singapore and worldwide, including but not limited to commercial / investment banking activities (including sponsorship, financial advisory or underwriting activities), brokerage or securities trading activities. Phillip Securities Research, or persons associated with or connected to Phillip Securities Research, including but not limited to its officers, directors, employees or persons involved in the issuance of this report, may have participated in or invested in transactions with the issuer(s) of the securities mentioned in this report, and may have performed services for or solicited business from such issuers. Additionally, Phillip Securities Research, or persons associated with or connected to Phillip Securities Research, including but not limited to its officers, directors, employees or persons involved in the issuance of this report, may have provided advice or investment services to such companies and investments or related investments, as may be mentioned in this report.
Phillip Securities Research or persons associated with or connected to Phillip Securities Research, including but not limited to its officers, directors, employees or persons involved in the issuance of this report may, from time to time maintain a long or short position in securities referred to herein, or in related futures or options, purchase or sell, make a market in, or engage in any other transaction involving such securities, and earn brokerage or other compensation in respect of the foregoing. Investments will be denominated in various currencies including US dollars and Euro and thus will be subject to any fluctuation in exchange rates between US dollars and Euro or foreign currencies and the currency of your own jurisdiction. Such fluctuations may have an adverse effect on the value, price or income return of the investment.
To the extent permitted by law, Phillip Securities Research, or persons associated with or connected to Phillip Securities Research, including but not limited to its officers, directors, employees or persons involved in the issuance of this report, may at any time engage in any of the above activities as set out above or otherwise hold an interest, whether material or not, in respect of companies and investments or related investments, which may be mentioned in this report. Accordingly, information may be available to Phillip Securities Research, or persons associated with or connected to Phillip Securities Research, including but not limited to its officers, directors, employees or persons involved in the issuance of this report, which is not reflected in this report, and Phillip Securities Research, or persons associated with or connected to Phillip Securities Research, including but not limited to its officers, directors, employees or persons involved in the issuance of this report, may, to the extent permitted by law, have acted upon or used the information prior to or immediately following its publication. Phillip Securities Research, or persons associated with or connected to Phillip Securities Research, including but not limited its officers, directors, employees or persons involved in the issuance of this report, may have issued other material that is inconsistent with, or reach different conclusions from, the contents of this report.
The information, tools and material presented herein are not directed, intended for distribution to or use by, any person or entity in any jurisdiction or country where such distribution, publication, availability or use would be contrary to the applicable law or regulation or which would subject Phillip Securities Research to any registration or licensing or other requirement, or penalty for contravention of such requirements within such jurisdiction.
This report is intended for general circulation only and does not take into account the specific investment objectives, financial situation or particular needs of any particular person. The products mentioned in this report may not be suitable for all investors and a person receiving or reading this report should seek advice from a professional and financial adviser regarding the legal, business, financial, tax and other aspects including the suitability of such products, taking into account the specific investment objectives, financial situation or particular needs of that person, before making a commitment to invest in any of such products.
This report is not intended for distribution, publication to or use by any person in any jurisdiction outside of Singapore or any other jurisdiction as Phillip Securities Research may determine in its absolute discretion.
IMPORTANT DISCLOSURES FOR INCLUDED RESEARCH ANALYSES OR REPORTS OF FOREIGN RESEARCH HOUSE
Where the report contains research analyses or reports from a foreign research house, please note:

Jeremy specialises in Technical Analysis and has 10 years of experience in studying price action. His areas of expertise include intermarket analysis on the equities, currencies, commodities and bonds market.
He is also a regular columnist on The Business Times - every Monday ChartPoint column.
He graduated with a Bachelor of Science in Banking and Finance from University of London.
