
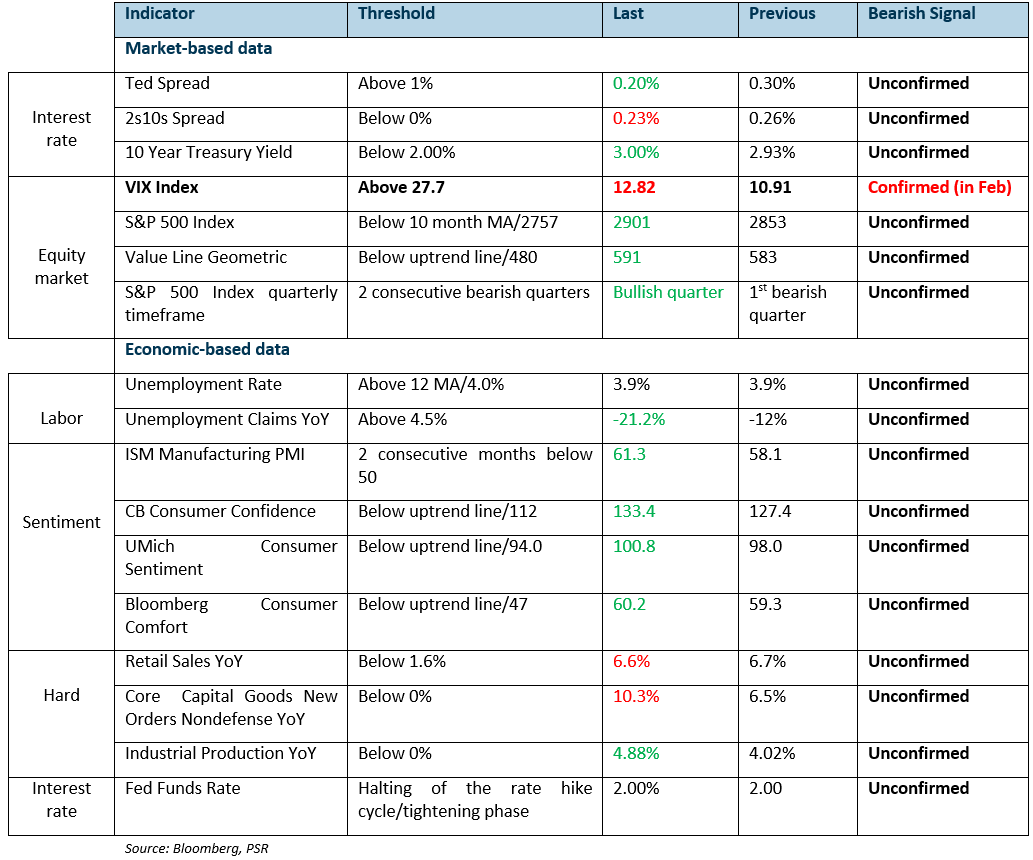
Our Phillip recession tracker is based on 17 market-based and economic-based indicators. The threshold represents the levels where bearish signal arises.
Red/Green represents deterioration/improvement from the prior month. Otherwise, it is unchanged.For more information on how we decipher the recession tracker indicators, refer to the report
All clear for now
All clear for now part 2
August was an eventful month filed with numerous newsflows ranging from trade tensions between the US and Turkey to the NAFTA trade deal. Emerging market scare went into the spotlight in early August after President Trump announced plans to double the tariffs on Steel and Aluminium from Turkey. The Turkish Lira immediately fell -15% against the Dollar on 10 August, and the Turkish Lira remains under pressure as it trades around 6.2000. This also led to a contagion effect to the rest of the weaker emerging markets such as Argentina as the Argentina Peso had devalued around -39% against the dollar since 10 August. Overall, the widespread weakness in the emerging markets and strength in the US dollar has affected the general sentiment of the European and Asian markets negatively.
The only outlier here is the US equity market with the main equity indices breaking new record highs in August while the rest of the world falls into a slumber especially the emerging markets.
August performance:
DJIA: +2.16% S&P 500: +3.03% Nasdaq 100: +5.78%
Despite the negative news in the emerging markets, there was other positive news that had more impact on the US equity market. Market participants seemed to have taken the positive trade deal between US and Mexico as the first step to the further de-escalation of trade tensions with Canada and more importantly China. The Dow Jones Industrial Average jolted higher by +1.1% on 27 August, the day when President Trump announced that he is terminating NAFTA as it now enters into a different deal with Mexico.
In the same week, Canada failed to reach a trade agreement on 31 August though officials are still in the midst of the trade negotiation to iron out the terms. Both the US and Canadian negotiators insisted that they were making progress. It is just a matter of time before both the US and Canada reach a trade agreement. Moreover, looking at the price action since 31 August shows minimal impact on the US equity market. Investors seemed to be shrugging off the no deal event and are expecting a trade deal to be reached in due course.
Once that happens, the next big catalyst that will provide further gas for the bullish market will be the de-escalation of trade tension between the US and China and possibly the end of the trade war.
There might be some clue that the Chinese government is ready to stand down from the trade war as they have chosen to defend the weakening Chinese Yuan. On 24 August, PBOC announced that it would resume the use of the counter-cyclical factor in the CNY midpoint fixing mechanism. The announcement of the re-introduction the counter-cyclical factor is done promptly as the USDCNH (offshore Yuan) treads near the “red-line” of 7.0000 psychological round number.
Keep in mind the past five months of Chinese Yuan devaluation is deliberately orchestrated by the Chinese government to minimise the impact of the heightened tariffs from the US. Put differently, one can view a rising USDCNH as a barometer for rising trade tensions while a falling USDCNH as a proxy from de-escalation. Thus, the recent reintroduction of the counter-cyclical factor is meant to halt the devaluation of the Chinese Yuan. On the day of the announcement, the Offshore Yuan gained 1.36% against the Dollar.
Figure 1: Offshore Yuan to stabilise moving forward with the re-implementation of the counter-cyclical factor
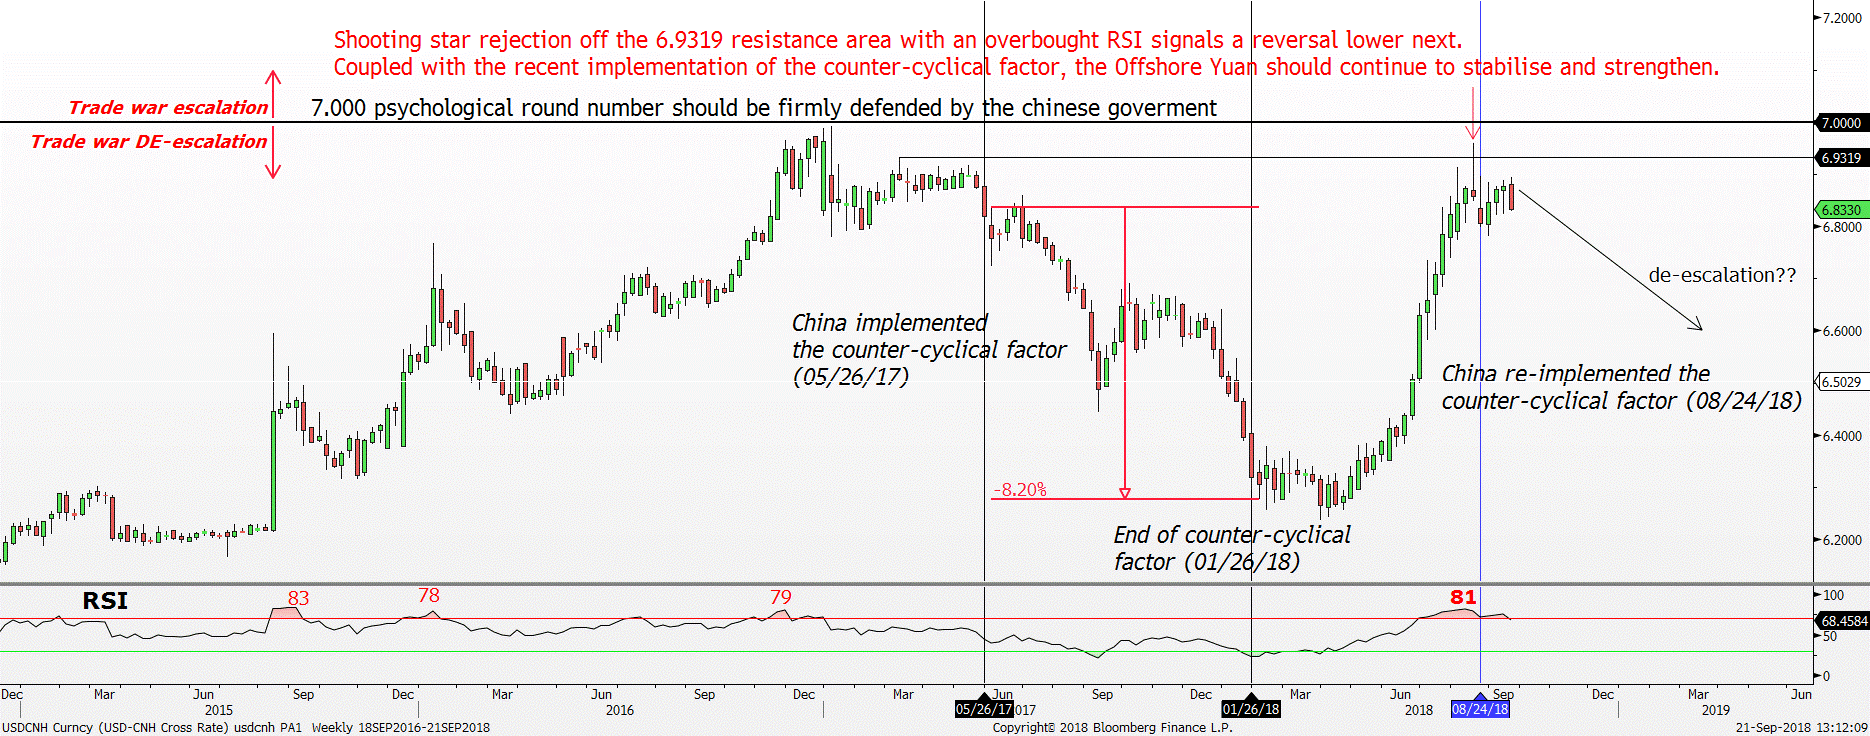
USDCNH Weekly chart Source: Bloomberg, PSR
*Vertical line shows the respective dates when the counter-cyclical factor is implemented or removed
The last time the PBOC introduced the counter-cyclical factor was in May 2017 when USDCNH was trading around the 6.9000 range. The USDCNH formed an immediate top and entered into a period of downtrend. Over the following 35 weeks where the counter-cyclical factor was in place, the offshore Yuan appreciated approximately 8% against the US dollar to 6.277.
Hence, if the counter-cyclical factor stays in place, we could expect a similar replay in the Chinese Yuan for a period of appreciation against the Dollar. That should spell well for the general equity market as the trade tensions ease off.
All in, staying data-dependant with the “Phillip Recession Tracker” continues to advise a risk-on approach as both the market-based and economic-based data continued to improve. Some more noteworthy data are the Conference Board Consumer Confidence and ISM Manufacturing PMI as both data hit another new multi-decade high signalling extreme optimism from both consumers and producers.
Figure 2: Phillip Recession Tracker – stay risk-on
Ted spread (3-month Libor – 3-month treasury yield)
Overall, the interbank level stayed relatively calm with no liquidity funding stress. In August, the Ted spread continued to compress lower to another 52-week low of 0.208% which is a positive sign. As long as the Ted spread stays in a relative range below 0.60%, the equity market should do just fine.
Our study shows that the key threshold that will signal the start of the bear market is when the Ted spread spikes violently above 1.00%.
Note: Rising Ted Spread signals increasing stress in the interbank market, vice versa.
Figure 3: Ted spread (0.19%) – all is well at the interbank level
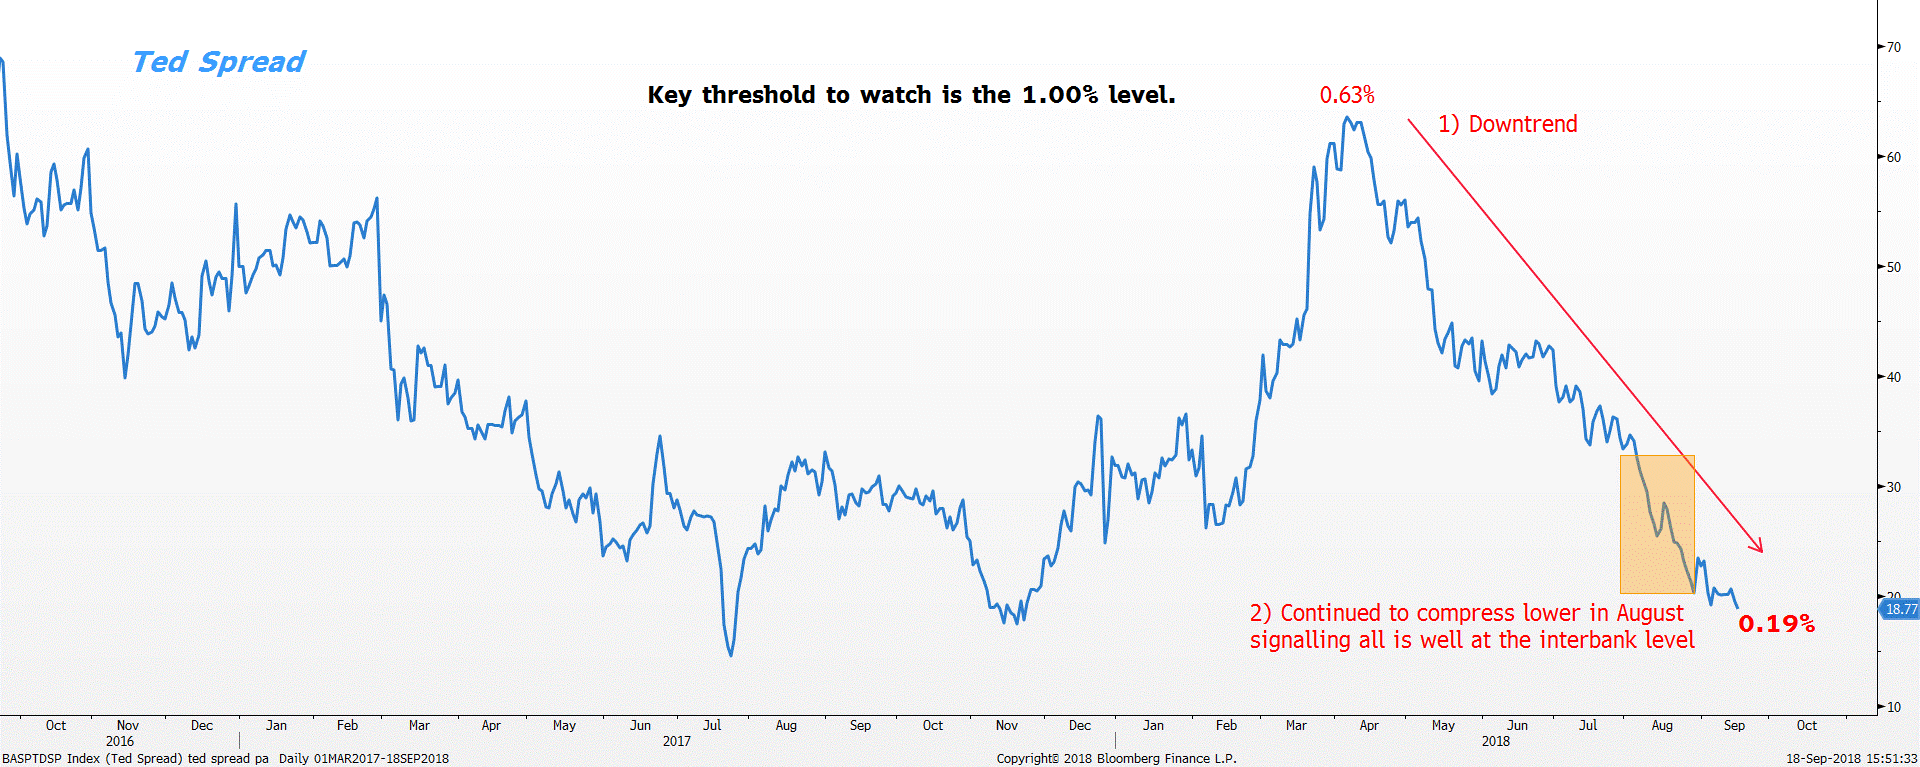
Source: Bloomberg, PSR
VIX index (Fear index)
The VIX index continued to trade relatively calmly below the 20 range in August. However, there is a warning sign flashing from the VIX Futures positioning. Speculators continued to pile onto the short side in August bringing the net amount to –120,000 contracts, an extreme high. Thus, continue to watch the speculator positioning as the current environment is setting up for a short squeeze similar to what happened in February 2018.
In the meantime, as long as the VIX index stays below the 20 range high, the equity market should continue to stair-step higher with reasonable volatility.
Figure 4: VIX index weekly timeframe – current short positioning is setting up for another short squeeze

Source: Bloomberg, PSR
* vertical lines demarcate the point when the short squeeze happens
Important Information
This report is prepared and/or distributed by Phillip Securities Research Pte Ltd ("Phillip Securities Research"), which is a holder of a financial adviser’s licence under the Financial Advisers Act, Chapter 110 in Singapore.
By receiving or reading this report, you agree to be bound by the terms and limitations set out below. Any failure to comply with these terms and limitations may constitute a violation of law. This report has been provided to you for personal use only and shall not be reproduced, distributed or published by you in whole or in part, for any purpose. If you have received this report by mistake, please delete or destroy it, and notify the sender immediately.
The information and any analysis, forecasts, projections, expectations and opinions (collectively, the “Research”) contained in this report has been obtained from public sources which Phillip Securities Research believes to be reliable. However, Phillip Securities Research does not make any representation or warranty, express or implied that such information or Research is accurate, complete or appropriate or should be relied upon as such. Any such information or Research contained in this report is subject to change, and Phillip Securities Research shall not have any responsibility to maintain or update the information or Research made available or to supply any corrections, updates or releases in connection therewith.
Any opinions, forecasts, assumptions, estimates, valuations and prices contained in this report are as of the date indicated and are subject to change at any time without prior notice. Past performance of any product referred to in this report is not indicative of future results.
This report does not constitute, and should not be used as a substitute for, tax, legal or investment advice. This report should not be relied upon exclusively or as authoritative, without further being subject to the recipient’s own independent verification and exercise of judgment. The fact that this report has been made available constitutes neither a recommendation to enter into a particular transaction, nor a representation that any product described in this report is suitable or appropriate for the recipient. Recipients should be aware that many of the products, which may be described in this report involve significant risks and may not be suitable for all investors, and that any decision to enter into transactions involving such products should not be made, unless all such risks are understood and an independent determination has been made that such transactions would be appropriate. Any discussion of the risks contained herein with respect to any product should not be considered to be a disclosure of all risks or a complete discussion of such risks.
Nothing in this report shall be construed to be an offer or solicitation for the purchase or sale of any product. Any decision to purchase any product mentioned in this report should take into account existing public information, including any registered prospectus in respect of such product.
Phillip Securities Research, or persons associated with or connected to Phillip Securities Research, including but not limited to its officers, directors, employees or persons involved in the issuance of this report, may provide an array of financial services to a large number of corporations in Singapore and worldwide, including but not limited to commercial / investment banking activities (including sponsorship, financial advisory or underwriting activities), brokerage or securities trading activities. Phillip Securities Research, or persons associated with or connected to Phillip Securities Research, including but not limited to its officers, directors, employees or persons involved in the issuance of this report, may have participated in or invested in transactions with the issuer(s) of the securities mentioned in this report, and may have performed services for or solicited business from such issuers. Additionally, Phillip Securities Research, or persons associated with or connected to Phillip Securities Research, including but not limited to its officers, directors, employees or persons involved in the issuance of this report, may have provided advice or investment services to such companies and investments or related investments, as may be mentioned in this report.
Phillip Securities Research or persons associated with or connected to Phillip Securities Research, including but not limited to its officers, directors, employees or persons involved in the issuance of this report may, from time to time maintain a long or short position in securities referred to herein, or in related futures or options, purchase or sell, make a market in, or engage in any other transaction involving such securities, and earn brokerage or other compensation in respect of the foregoing. Investments will be denominated in various currencies including US dollars and Euro and thus will be subject to any fluctuation in exchange rates between US dollars and Euro or foreign currencies and the currency of your own jurisdiction. Such fluctuations may have an adverse effect on the value, price or income return of the investment.
To the extent permitted by law, Phillip Securities Research, or persons associated with or connected to Phillip Securities Research, including but not limited to its officers, directors, employees or persons involved in the issuance of this report, may at any time engage in any of the above activities as set out above or otherwise hold an interest, whether material or not, in respect of companies and investments or related investments, which may be mentioned in this report. Accordingly, information may be available to Phillip Securities Research, or persons associated with or connected to Phillip Securities Research, including but not limited to its officers, directors, employees or persons involved in the issuance of this report, which is not reflected in this report, and Phillip Securities Research, or persons associated with or connected to Phillip Securities Research, including but not limited to its officers, directors, employees or persons involved in the issuance of this report, may, to the extent permitted by law, have acted upon or used the information prior to or immediately following its publication. Phillip Securities Research, or persons associated with or connected to Phillip Securities Research, including but not limited its officers, directors, employees or persons involved in the issuance of this report, may have issued other material that is inconsistent with, or reach different conclusions from, the contents of this report.
The information, tools and material presented herein are not directed, intended for distribution to or use by, any person or entity in any jurisdiction or country where such distribution, publication, availability or use would be contrary to the applicable law or regulation or which would subject Phillip Securities Research to any registration or licensing or other requirement, or penalty for contravention of such requirements within such jurisdiction.
This report is intended for general circulation only and does not take into account the specific investment objectives, financial situation or particular needs of any particular person. The products mentioned in this report may not be suitable for all investors and a person receiving or reading this report should seek advice from a professional and financial adviser regarding the legal, business, financial, tax and other aspects including the suitability of such products, taking into account the specific investment objectives, financial situation or particular needs of that person, before making a commitment to invest in any of such products.
This report is not intended for distribution, publication to or use by any person in any jurisdiction outside of Singapore or any other jurisdiction as Phillip Securities Research may determine in its absolute discretion.
IMPORTANT DISCLOSURES FOR INCLUDED RESEARCH ANALYSES OR REPORTS OF FOREIGN RESEARCH HOUSE
Where the report contains research analyses or reports from a foreign research house, please note:

Jeremy specialises in Technical Analysis and has 10 years of experience in studying price action. His areas of expertise include intermarket analysis on the equities, currencies, commodities and bonds market.
He is also a regular columnist on The Business Times - every Monday ChartPoint column.
He graduated with a Bachelor of Science in Banking and Finance from University of London.
