Technical Pulse: Singapore Exchange Ltd January 25, 2021 895

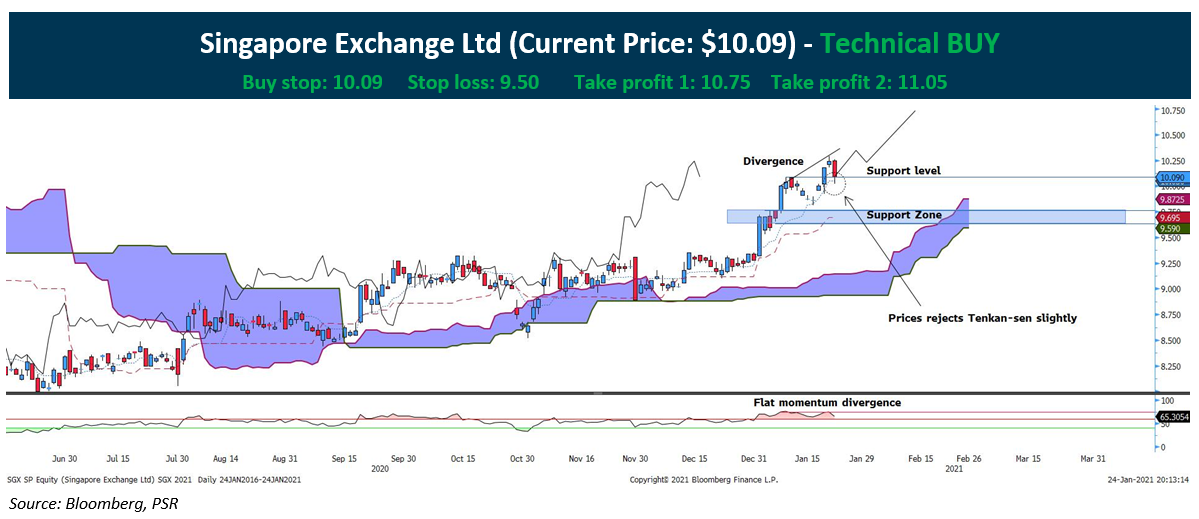
SGX Ltd (SGX: S68) Technical is pointing to a further upside after the stock has broken the long-time resistance at $9.30 and has met our previous target price based on our report on 26th November 2020:

  1. Despite an evening star forming last Friday, prices managed to close slightly above the support level at $10.09. Pointing to a possible upside.
  2. The bearish candle shadow has briefly reject the Tenkan-sen, which temporarily resume its uptrend indication where by the rest has shown that prices is trending above the rest of the indicators.
  3. However, there is still risk of downside as prices has display a flat bearish momentum divergence and with an evening star, there still poised a threat of a sell down. Should there be a selling, the price should find some support at $9.75 or $9.35.


*Timeline of the trade is 4 weeks from the date issued.


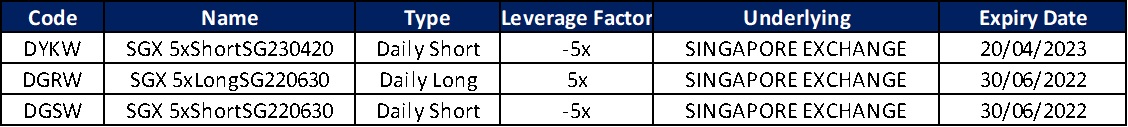
Investors are advised to read the issuer documents found on SGX website here or the issuer’s DLC website here for the full details of the DLCs including the product features and the risks before investing in the DLCs.


CHART LEGENDS

Ichimoku Kinko Hyo

Red dotted line = 9 Periods Tenkan-Sen

Blue dotted line = 26 periods Kijun-Sen

Green Line B= 52 periods Senkou Span B

Pink Line A = 26 periods Senkou Span A

Black line = 26 periods Chikou Span. Lagging line

Subscribe
Notify of
guest
0 Comments
Inline Feedbacks
View all comments

Get access to all the latest market news, reports, technical analysis
by signing up for a free account today!