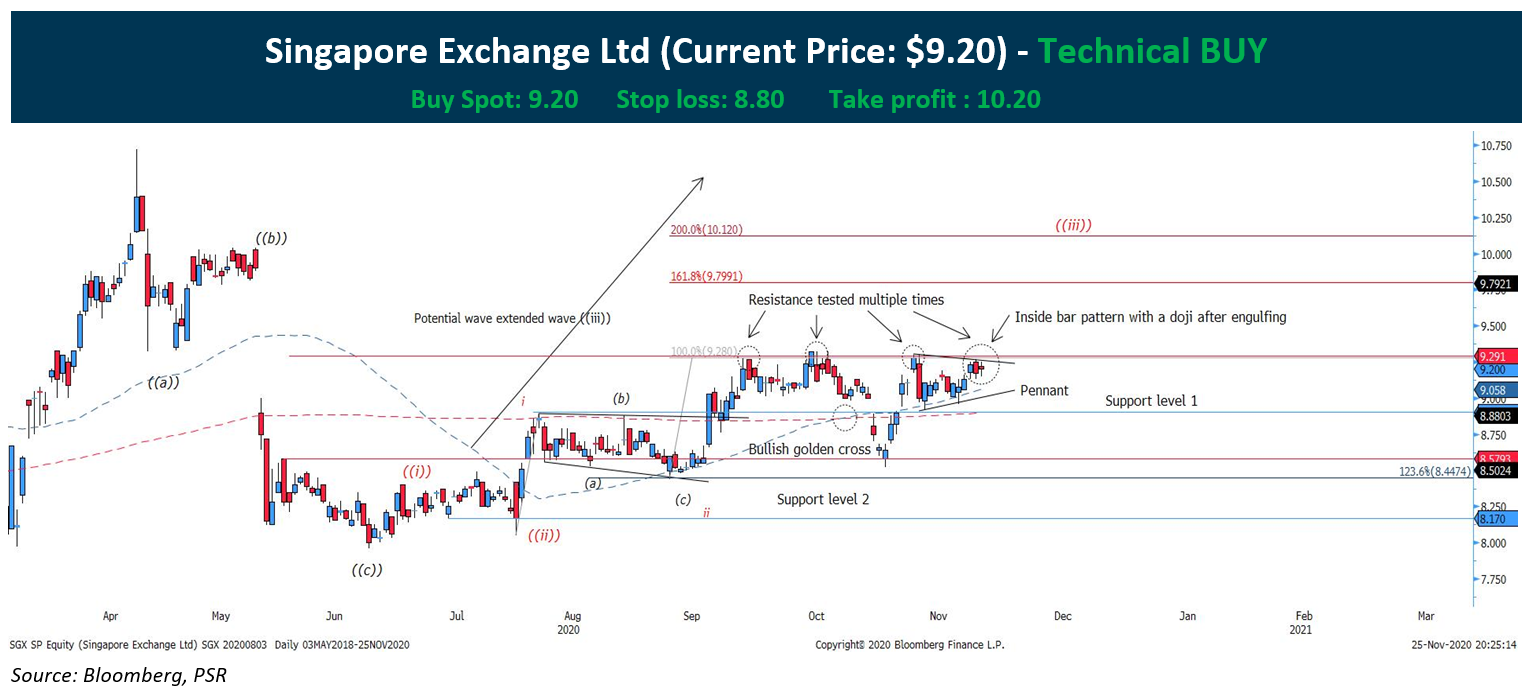
Singapore Exchange (SGX: S68) had a strong gap down the following day after we published our report on 27th October 2020. However, prices recovered soon after and the recent technical indicate that the stock will head for a bullish rise.
- The wave structure remains unchanged despite the strong gap down.
- The immediate resistance level at $9.29 was tested 4 times and this has weaken the resistance.
- The pennant formation is indicative of the bullish continuation pattern. Also, the sell-off after the third rejects rebounded at $9.00, which indicate a short fall, hence, the bulls might be coming real soon.
- The golden cross remain well intact as prices still trends above the 50 and 200-day moving averages.
*Timeline of the trade is 4 weeks from the date issued.
CHART LEGENDS
Moving Average
Red dotted line = 200-day moving average
Blue dotted line = 50-day moving average
