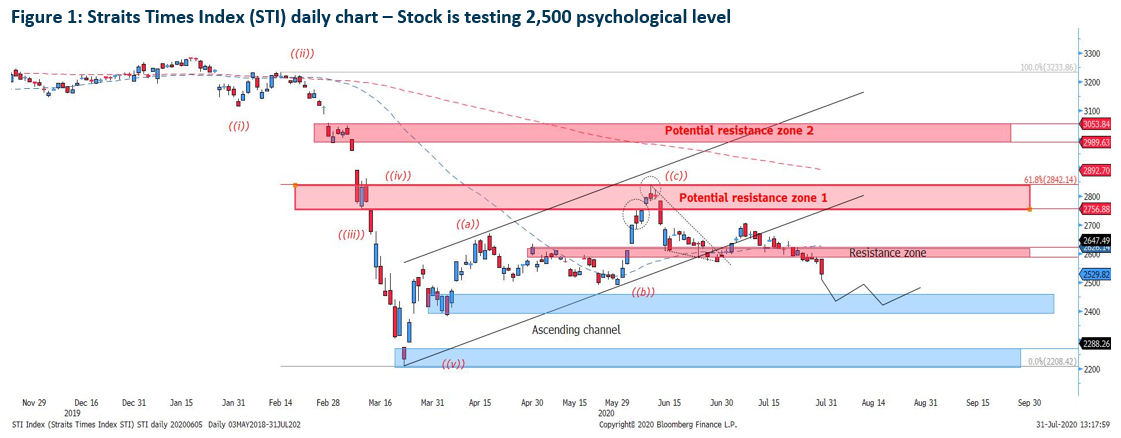
On our 20th July report, we mention that the next rebound will likely be at 2,500 region and as the STI closes at 2,529 last Thursday, there is a possibility that Monday we will experience a slight rebound. However, as the STI has ended with a lower low, we are seeing a downtrend for now especially it breaks out of the ascending channel 2 weeks ago.
Moving forward, the mid-term out look based on the technicals suggest that the downward trajectory is still ongoing with prices testing 2,400 regions.
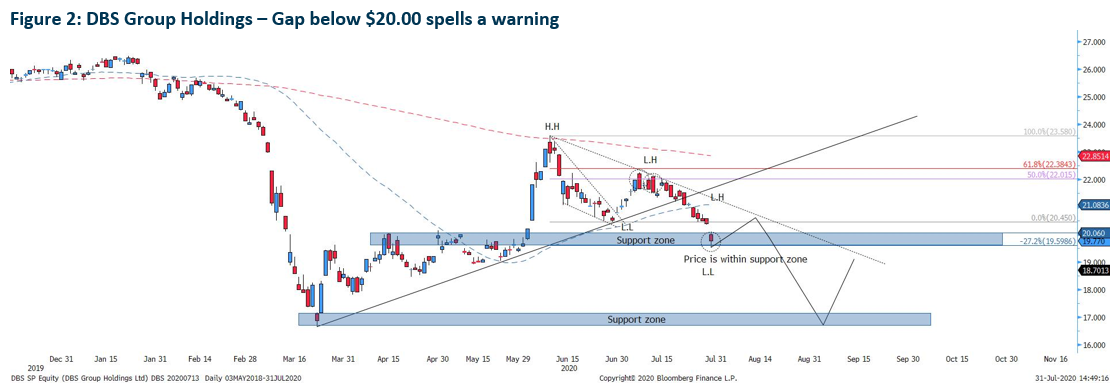
The safety net of $20.00 has been breached and it is submerging right under the psychological support level of $20.00. Although prices remain well within the support zone as highlighted in the chart, the fact that it gaps down on last Thursday when market open indicate a strong selling pressure. To add on the bearish sentiment, prices has been making a series of lower high and lower lows which indicate a renewed downtrend going forward.
Moving forward, the stock may attempt to rise back above the $20.00 region but the recovery will be seen as a correction unless prices swiftly closes above $21.00 within the next 6-8 periods.
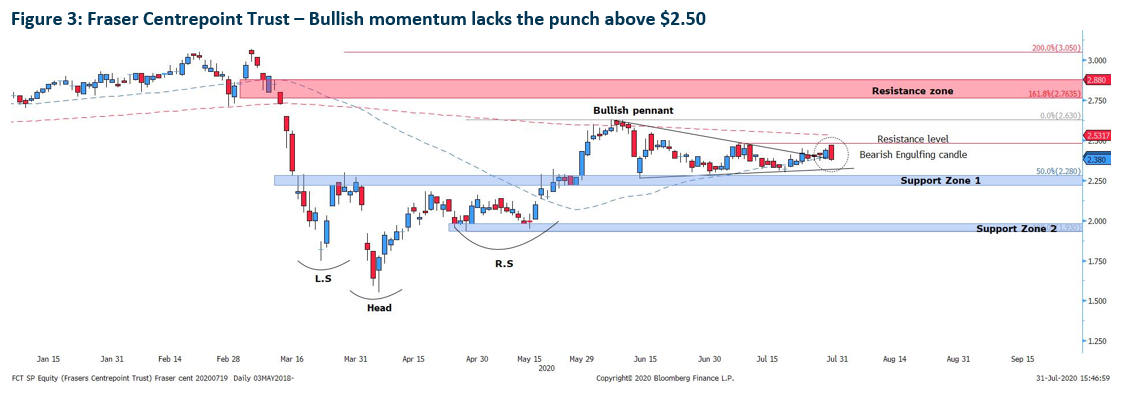
As we have mention on our stocks update report on 20th July, Fraser Centrepoint Trust will likely head lower to test the support zone 1 at $2.28-$2.21 despite a reversal at $2.30 with a morning star formation. However, the rising momentum is slow and is seen like a correction, last Thursday bearish Engulfing candle wipe out 50% of the gains. As such, the likelihood of Fraser Centrepoint trust testing the support zone one has increased.
Should the support zone 1 become invalidated, the next potential rebound will be at zone 2 ($1.93-$2.00).
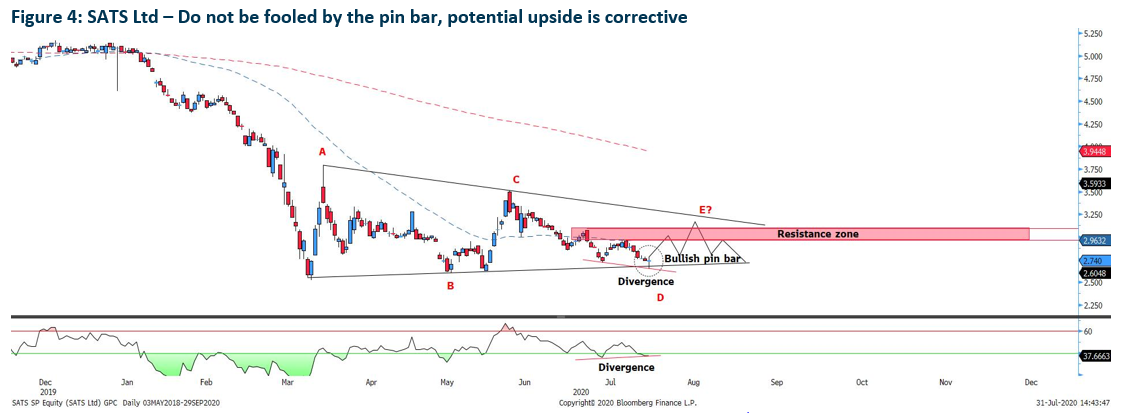
SATS’s downside move has move according to our expectation based on our report on 23rd July. As price edge lower on the first half of the trading session last Thursday, the buying quickly emerged on the 2nd half of the session which closes the candle as a bullish hammer/pinbar. Although the divergence shown on the Relative Strength Index is significant, the potential upside is corrective in nature as the 5-wave Triangle is still ongoing. The last leg of potential wave E is going to test the resistance zone at $2.96-$3.06.
The only hope that the stock resuming it’s bullish upside is price invalidate the top resistance zone at $3.92-$3.38.
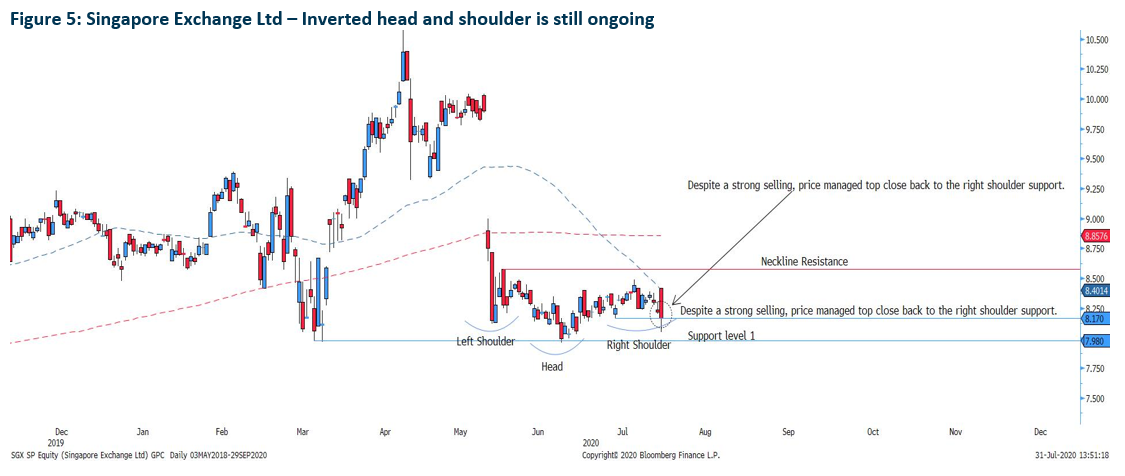
The inverted head and shoulder which we mention on our report dated 24th July is still intact despite the strong selling last Thursday. As the last hour of trading, prices manage to recover back to the right shoulder support level at $8.17.
The only crucial factor which will invalidate the bullish outlook is should prices breaks below the support level at $7.98, then the next price target will be at the at $7.55.
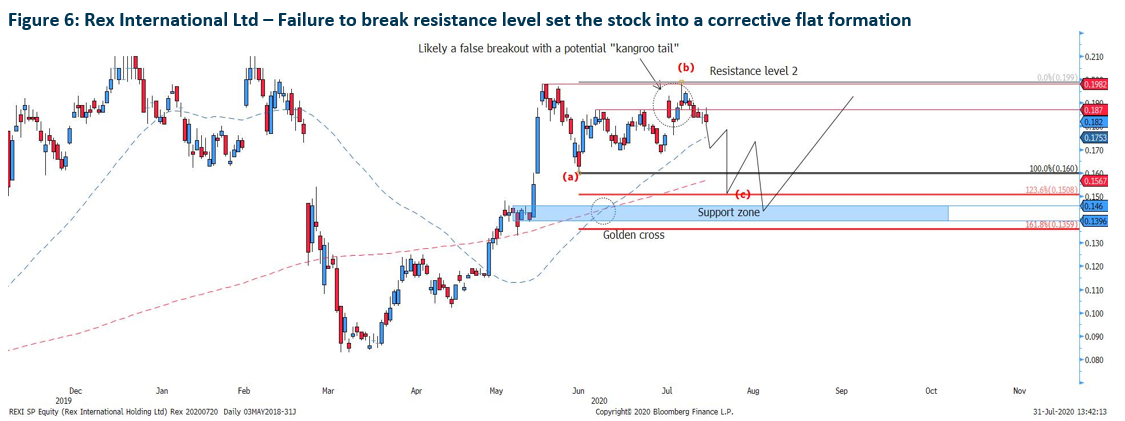
The formation of a “Kangaroo tail” has set Rex international into a renewed selling pressure with the stock setting its course onto a 5 sub-wave to form wave C. As such, we expect prices to fall beyond the support level at $0.160 and find its potential support at $0.146-$0.139.
Zooming out and look at the larger picture, the recovery after reaching its support zone may be limited and the overall price action suggest that the stock will be ranging for a prolong period of time as prices will have a hard time breaching above $0.200.
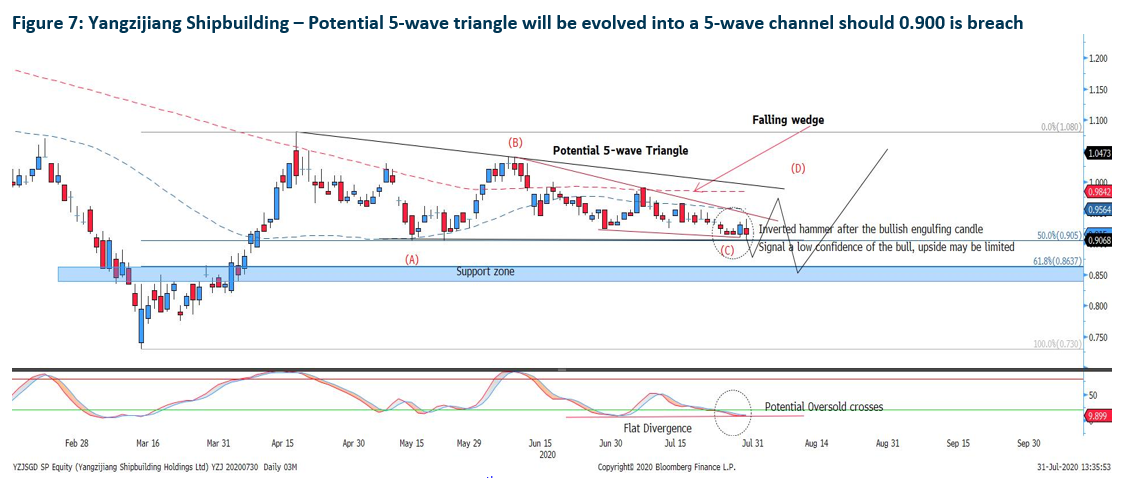
We had a strong conviction on a short bullish upside on 30th July after a bullish engulfing candle was formed. However, the formation of inverted hammer after the engulfing sparks a no confident of the bullish upside and instead, we believe that Yangzijiang will continue to slide further to test the support at $0.865, which confluence with the 61.8% Fibonacci retracement level before a rebound.
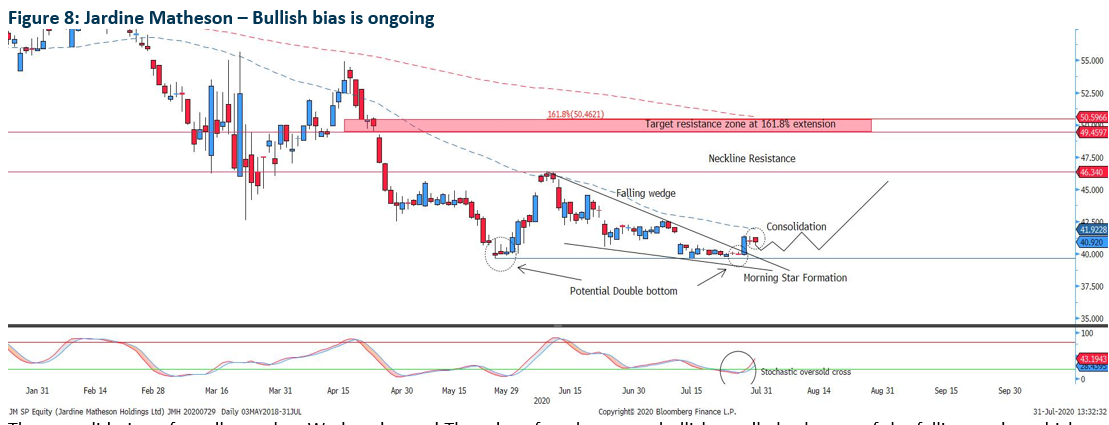
The consolidation of candles on last Wednesday and Thursday after the strong bullish candle broke out of the falling wedge which we mention on our report on 29th July. In regards to the consolidation, we are expecting further consolidation between $40.72 and $41.33 before prices set to rally once again to test the neckline resistance at $46.34 of the potential double bottom.
However, should prices fell below the psychological support level at $40.00 in the next 3 periods, the stock will test the lower levels at $35.71 to $33.26.
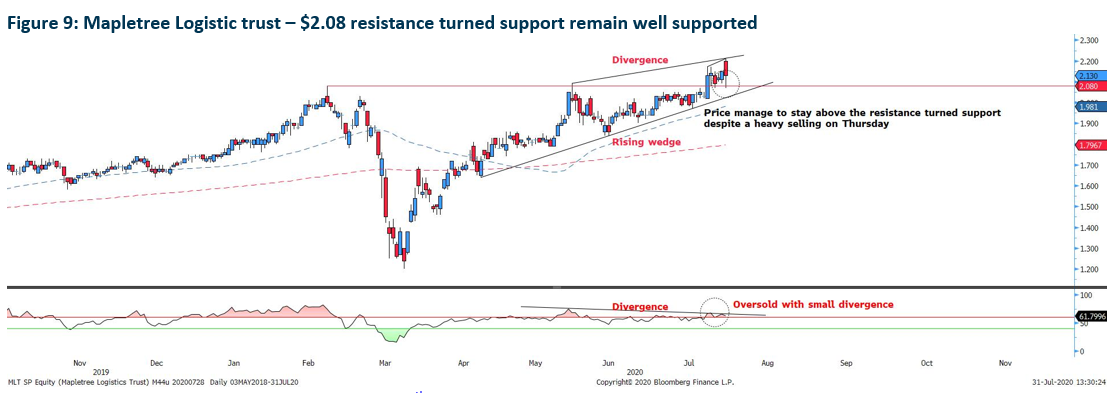
The bearish outlook based on our report on the 28th of July is likely to be invalidated after the evening star formation fails to close below the resistance turned support level at $2.08. To add on, last Thursday strong selling sees prices rebounded at $2.08 after a smaller divergence and oversold above the RSI 60 level indicate that the buying momentum is still in the game. As such, we are still positive on Mapletree Logistic Trust hitting our target price at $2.25 based on our report on 17th of June
Important Information
This report is prepared and/or distributed by Phillip Securities Research Pte Ltd ("Phillip Securities Research"), which is a holder of a financial adviser’s licence under the Financial Advisers Act, Chapter 110 in Singapore.
By receiving or reading this report, you agree to be bound by the terms and limitations set out below. Any failure to comply with these terms and limitations may constitute a violation of law. This report has been provided to you for personal use only and shall not be reproduced, distributed or published by you in whole or in part, for any purpose. If you have received this report by mistake, please delete or destroy it, and notify the sender immediately.
The information and any analysis, forecasts, projections, expectations and opinions (collectively, the “Research”) contained in this report has been obtained from public sources which Phillip Securities Research believes to be reliable. However, Phillip Securities Research does not make any representation or warranty, express or implied that such information or Research is accurate, complete or appropriate or should be relied upon as such. Any such information or Research contained in this report is subject to change, and Phillip Securities Research shall not have any responsibility to maintain or update the information or Research made available or to supply any corrections, updates or releases in connection therewith.
Any opinions, forecasts, assumptions, estimates, valuations and prices contained in this report are as of the date indicated and are subject to change at any time without prior notice. Past performance of any product referred to in this report is not indicative of future results.
This report does not constitute, and should not be used as a substitute for, tax, legal or investment advice. This report should not be relied upon exclusively or as authoritative, without further being subject to the recipient’s own independent verification and exercise of judgment. The fact that this report has been made available constitutes neither a recommendation to enter into a particular transaction, nor a representation that any product described in this report is suitable or appropriate for the recipient. Recipients should be aware that many of the products, which may be described in this report involve significant risks and may not be suitable for all investors, and that any decision to enter into transactions involving such products should not be made, unless all such risks are understood and an independent determination has been made that such transactions would be appropriate. Any discussion of the risks contained herein with respect to any product should not be considered to be a disclosure of all risks or a complete discussion of such risks.
Nothing in this report shall be construed to be an offer or solicitation for the purchase or sale of any product. Any decision to purchase any product mentioned in this report should take into account existing public information, including any registered prospectus in respect of such product.
Phillip Securities Research, or persons associated with or connected to Phillip Securities Research, including but not limited to its officers, directors, employees or persons involved in the issuance of this report, may provide an array of financial services to a large number of corporations in Singapore and worldwide, including but not limited to commercial / investment banking activities (including sponsorship, financial advisory or underwriting activities), brokerage or securities trading activities. Phillip Securities Research, or persons associated with or connected to Phillip Securities Research, including but not limited to its officers, directors, employees or persons involved in the issuance of this report, may have participated in or invested in transactions with the issuer(s) of the securities mentioned in this report, and may have performed services for or solicited business from such issuers. Additionally, Phillip Securities Research, or persons associated with or connected to Phillip Securities Research, including but not limited to its officers, directors, employees or persons involved in the issuance of this report, may have provided advice or investment services to such companies and investments or related investments, as may be mentioned in this report.
Phillip Securities Research or persons associated with or connected to Phillip Securities Research, including but not limited to its officers, directors, employees or persons involved in the issuance of this report may, from time to time maintain a long or short position in securities referred to herein, or in related futures or options, purchase or sell, make a market in, or engage in any other transaction involving such securities, and earn brokerage or other compensation in respect of the foregoing. Investments will be denominated in various currencies including US dollars and Euro and thus will be subject to any fluctuation in exchange rates between US dollars and Euro or foreign currencies and the currency of your own jurisdiction. Such fluctuations may have an adverse effect on the value, price or income return of the investment.
To the extent permitted by law, Phillip Securities Research, or persons associated with or connected to Phillip Securities Research, including but not limited to its officers, directors, employees or persons involved in the issuance of this report, may at any time engage in any of the above activities as set out above or otherwise hold an interest, whether material or not, in respect of companies and investments or related investments, which may be mentioned in this report. Accordingly, information may be available to Phillip Securities Research, or persons associated with or connected to Phillip Securities Research, including but not limited to its officers, directors, employees or persons involved in the issuance of this report, which is not reflected in this report, and Phillip Securities Research, or persons associated with or connected to Phillip Securities Research, including but not limited to its officers, directors, employees or persons involved in the issuance of this report, may, to the extent permitted by law, have acted upon or used the information prior to or immediately following its publication. Phillip Securities Research, or persons associated with or connected to Phillip Securities Research, including but not limited its officers, directors, employees or persons involved in the issuance of this report, may have issued other material that is inconsistent with, or reach different conclusions from, the contents of this report.
The information, tools and material presented herein are not directed, intended for distribution to or use by, any person or entity in any jurisdiction or country where such distribution, publication, availability or use would be contrary to the applicable law or regulation or which would subject Phillip Securities Research to any registration or licensing or other requirement, or penalty for contravention of such requirements within such jurisdiction.
This report is intended for general circulation only and does not take into account the specific investment objectives, financial situation or particular needs of any particular person. The products mentioned in this report may not be suitable for all investors and a person receiving or reading this report should seek advice from a professional and financial adviser regarding the legal, business, financial, tax and other aspects including the suitability of such products, taking into account the specific investment objectives, financial situation or particular needs of that person, before making a commitment to invest in any of such products.
This report is not intended for distribution, publication to or use by any person in any jurisdiction outside of Singapore or any other jurisdiction as Phillip Securities Research may determine in its absolute discretion.
IMPORTANT DISCLOSURES FOR INCLUDED RESEARCH ANALYSES OR REPORTS OF FOREIGN RESEARCH HOUSE
Where the report contains research analyses or reports from a foreign research house, please note:
