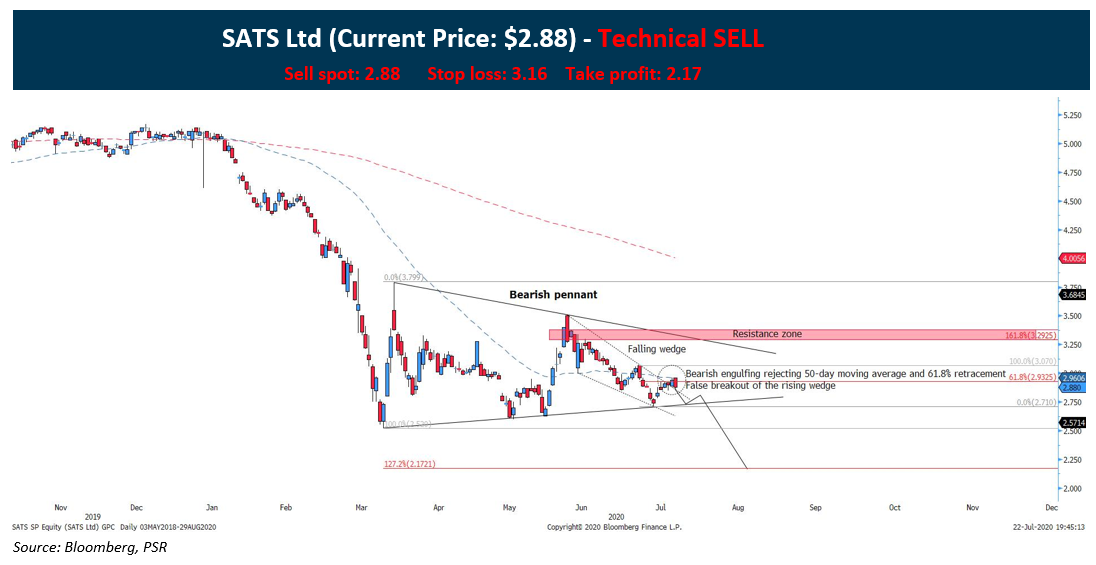
SATS (SGX: S58) had a very strong impulse down move since the start of 2020 and based on the recent technicals, the stock is heading for another round of selling:
- The recovery in mid-March met with a failure to clear above $3.50. Subsequent price moves did not clear the highs in mid-March. The converging of candles formed into a bearish pennant, indicative of corrective action.
- The smaller falling wedge that formed within the pennant had a false breakout on Wednesday close after the bearish engulfing candle failed to clear above the 61.8% retracement level and it rejects the 50% Fibonacci retracement level.
- Target price is 127.2% of the bearish pennant.
*Timeline of the trade should be between 1-3 weeks from the date issued.
*Should price break the immediate resistance of $3.07 in the next 4-5 periods. Then the next selling zone will be at $3.92-$3.38
CHART LEGENDS
Moving average
Red dotted line = 200 periods Moving average
Blue dotted line = 50 periods Moving average