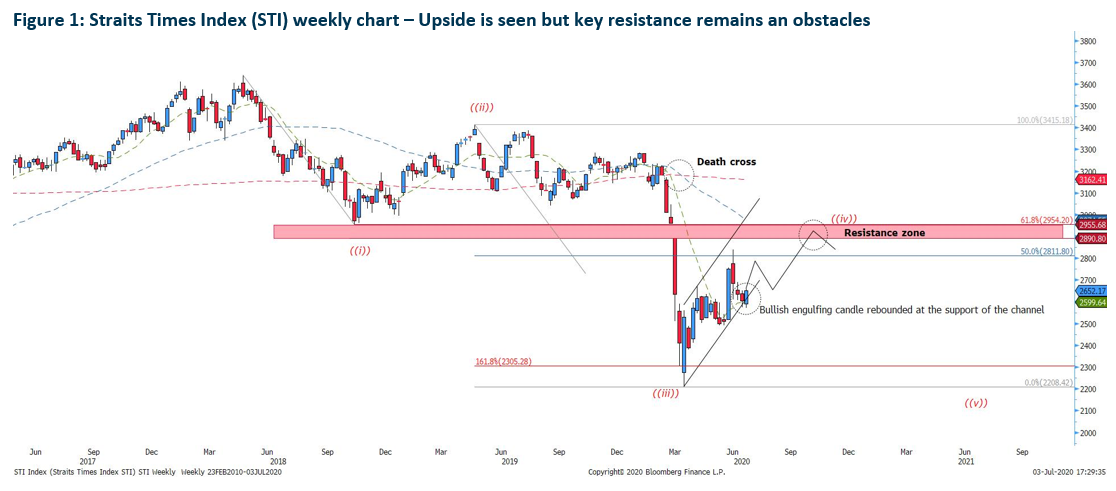
The Straits Time Index weekly chart has seen some uptick but prices remain below the key resistance level at 3,000. Ever since the sell-down started in March, STI fell below 2,500 for the first time since 2011 and although it rebounded like what was mentioned in 27th April 2020 report, where prices rebounded near the support at 2,305, the 161.8% expansion level of sub-wave 3.
Last month, prices had a strong sell-down below 50% of wave 3 but as of last Friday, a bullish engulfing candle was seen at the lower support level of the channel. As such, we see a high probability of STI testing the resistance zone between 2,900 and 2,954. Once the 50% level is broken. For the market to resume its bullish outlook, the Straits Time Index needs to break above the 3,000 psychological level minimally. Otherwise, the upside will be seen as a corrective action.
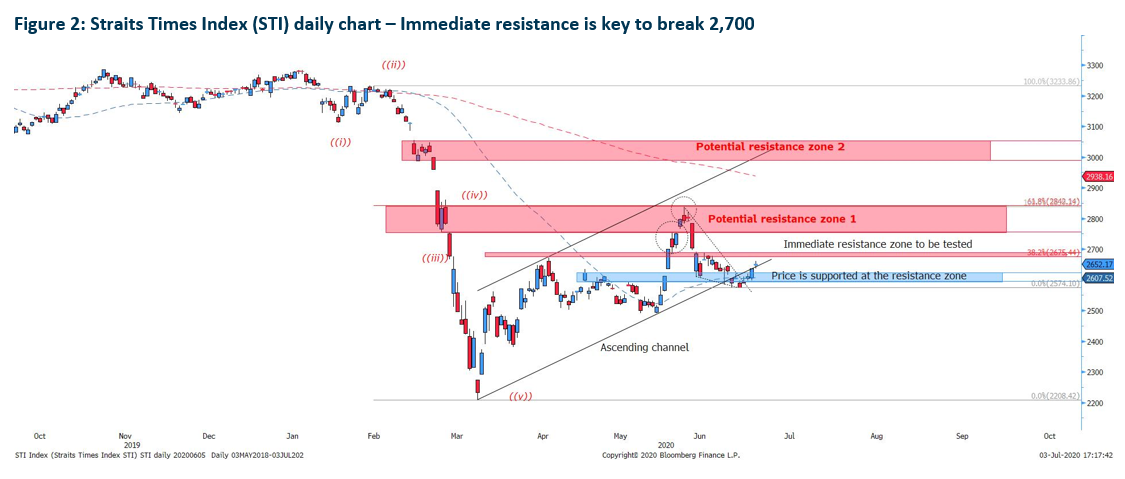
The daily chart presents a clearer picture with prices well supported above 2,636.05-2,598.40. As such, we believe that the index will test the resistance zone at 2,900, which is in confluence with our weekly chart analysis.
STI has also broken out of the falling wedge on Thursday together where the support and the rebound was the strongest in the past 2 weeks. However, near-term resistance level at 2,692 remains a strong obstacle to be cleared.
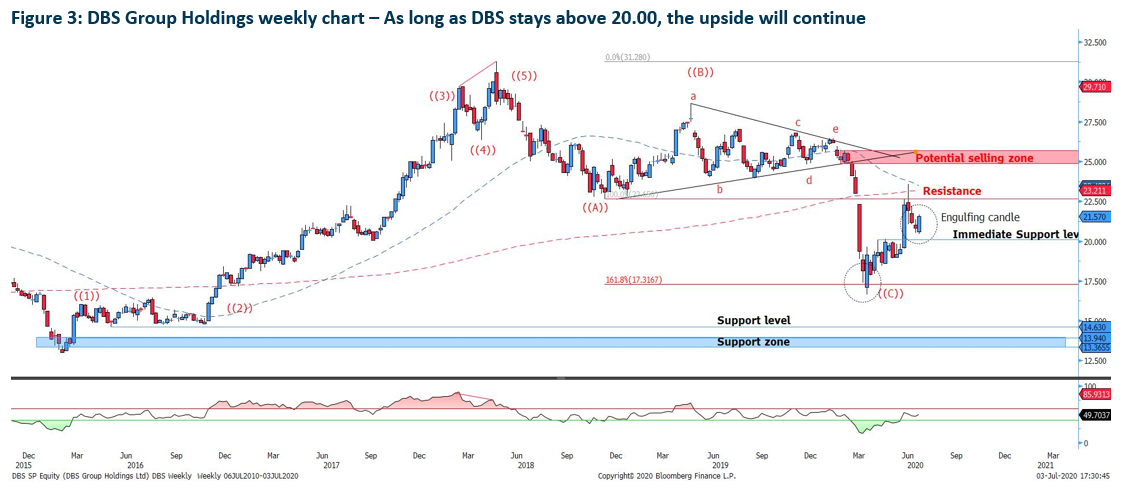
DBS group share price rebounded at 17.31, which is aligned to our past report in 18th March. However, we are cautious as we take this rebound as a recovery of the Elliott wave analysis. Technicals indicate that there might be another extension of wave C. First the stock closed below the resistance level of 22.50 after intense selling 3 weeks ago.
As long as the stock stays well supported above 20.00, the stock will be safe with the bulls and it is likely to test the resistance zone at 25.00.
However, should DBS fail to clear pass 22.50-23.24, DBS will form a complex corrective flat pattern which sees prices ranging from 22.50 to 20.00 range.
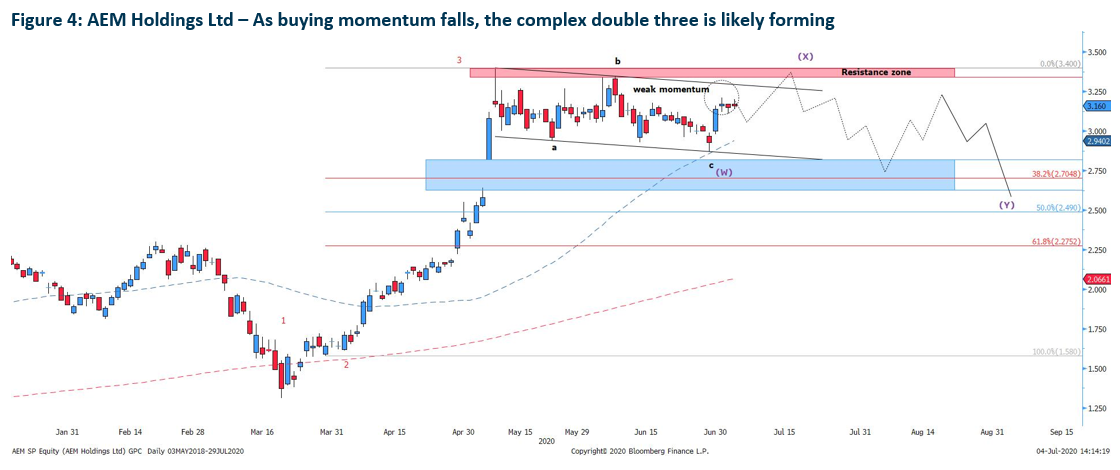
AEM Holdings had a strong rebound on the 30th of June after breaking out of the falling wedge within the bullish flag. We issued a report on 1st July stating that there is a bullish upside to test the higher resistance zone at $3.35-$3.41. However, the momentum did not last and was ranging for the next 3 consecutive periods with dojis candle in place, signifying a halt.
The falling momentum has increased the probability of a complexed corrective wave of the double three and we should see price testing the $3.00 psychological support before a rebound to test the next resistance zone at $3.35-$3.41.
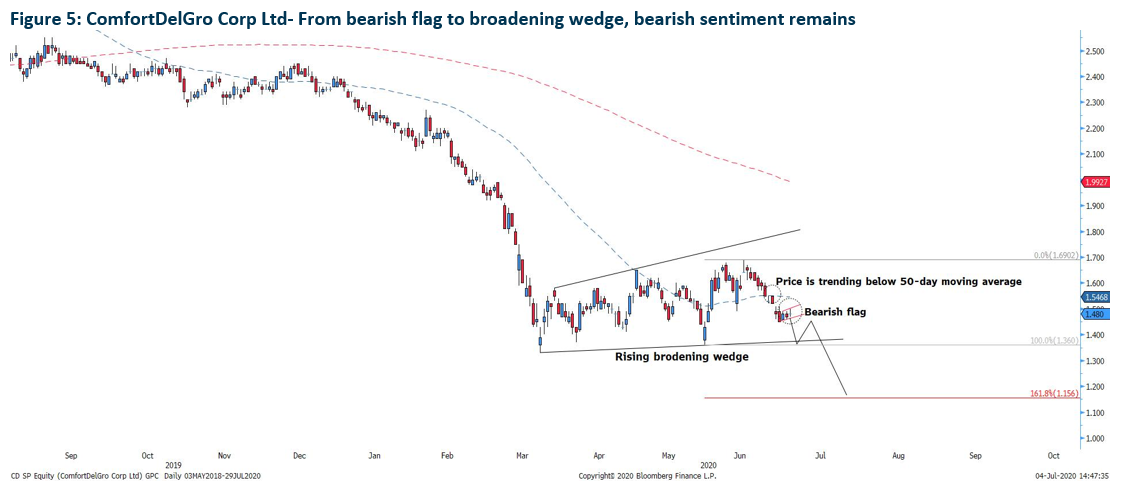
ComfortDelGro initial sell-off on 10th June was met with a strong piercing line candle which we had mentioned on our 15th June Singapore stocks update report. The stock as expected went back to test the resistance zone 1 $1.64 and $1.68and the next sell-off occurs once again.
From a bearish flag/channel, it evolved into a rising broadening wedge which sees the stock plunging further as the pattern is considered a strong continuation pattern. Furthermore, the bearish flag within the larger broadening wedge sent a signal that the stock will fall further to test the support at $1.32-$1.36. Should that level be broken, we would see further downside to 161.8% Fibonacci extension level at $1.15.
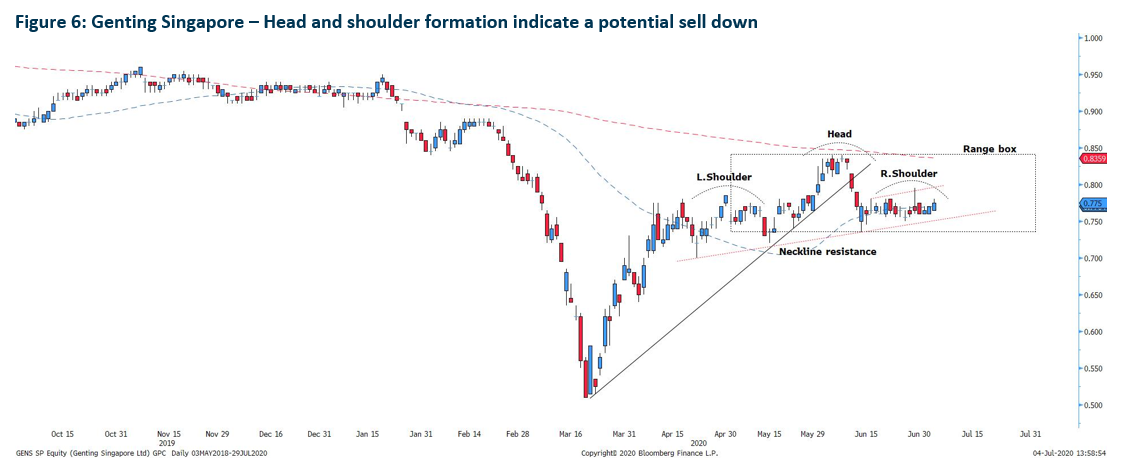
Genting Singapore has seen some upside as of late last week but the stock remains bearish as prices are still trending below the 200-day moving average and the Friday’s candle did not manage to close above the 50-day moving average, amid low momentum and pressure.
The formation of the larger head and shoulder formation and the bearish flag at the right shoulder gave us a signal that Genting is getting ready to further collapse towards 0.625 which we mention in our report on 30th June.
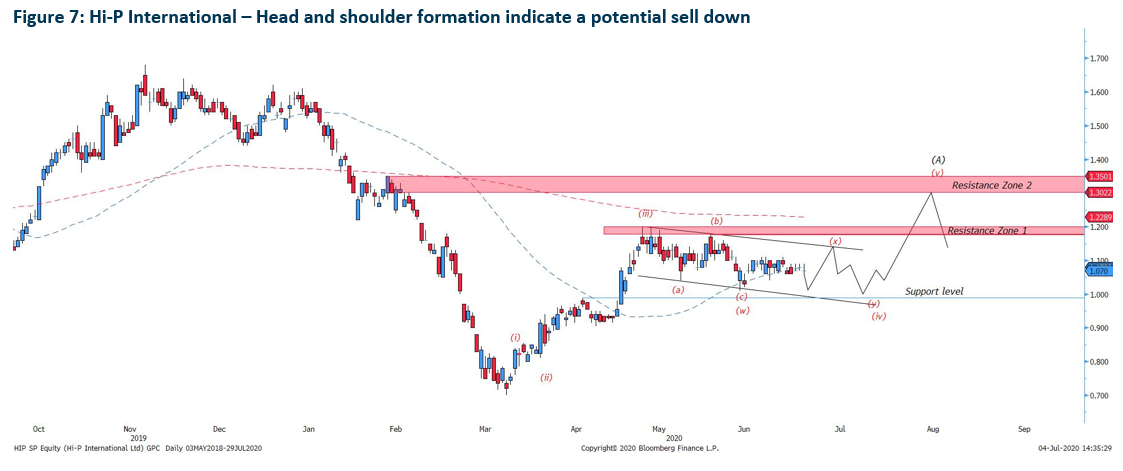
Hi-P will enter into a complex double three pattern after a weakening momentum is seen after 26th June 2020. Same as AEM, we would see the first rebound at $1.00 region and should price fails to break $1.15, we would see another round of correction back to $1.00.
To add on, the resistance zone 1 is a crucial zone as failing to break will means a truncated sub-fifth wave and usually the following impulse wave will be much stronger as it lacks the momentum.
Important Information
This report is prepared and/or distributed by Phillip Securities Research Pte Ltd ("Phillip Securities Research"), which is a holder of a financial adviser’s licence under the Financial Advisers Act, Chapter 110 in Singapore.
By receiving or reading this report, you agree to be bound by the terms and limitations set out below. Any failure to comply with these terms and limitations may constitute a violation of law. This report has been provided to you for personal use only and shall not be reproduced, distributed or published by you in whole or in part, for any purpose. If you have received this report by mistake, please delete or destroy it, and notify the sender immediately.
The information and any analysis, forecasts, projections, expectations and opinions (collectively, the “Research”) contained in this report has been obtained from public sources which Phillip Securities Research believes to be reliable. However, Phillip Securities Research does not make any representation or warranty, express or implied that such information or Research is accurate, complete or appropriate or should be relied upon as such. Any such information or Research contained in this report is subject to change, and Phillip Securities Research shall not have any responsibility to maintain or update the information or Research made available or to supply any corrections, updates or releases in connection therewith.
Any opinions, forecasts, assumptions, estimates, valuations and prices contained in this report are as of the date indicated and are subject to change at any time without prior notice. Past performance of any product referred to in this report is not indicative of future results.
This report does not constitute, and should not be used as a substitute for, tax, legal or investment advice. This report should not be relied upon exclusively or as authoritative, without further being subject to the recipient’s own independent verification and exercise of judgment. The fact that this report has been made available constitutes neither a recommendation to enter into a particular transaction, nor a representation that any product described in this report is suitable or appropriate for the recipient. Recipients should be aware that many of the products, which may be described in this report involve significant risks and may not be suitable for all investors, and that any decision to enter into transactions involving such products should not be made, unless all such risks are understood and an independent determination has been made that such transactions would be appropriate. Any discussion of the risks contained herein with respect to any product should not be considered to be a disclosure of all risks or a complete discussion of such risks.
Nothing in this report shall be construed to be an offer or solicitation for the purchase or sale of any product. Any decision to purchase any product mentioned in this report should take into account existing public information, including any registered prospectus in respect of such product.
Phillip Securities Research, or persons associated with or connected to Phillip Securities Research, including but not limited to its officers, directors, employees or persons involved in the issuance of this report, may provide an array of financial services to a large number of corporations in Singapore and worldwide, including but not limited to commercial / investment banking activities (including sponsorship, financial advisory or underwriting activities), brokerage or securities trading activities. Phillip Securities Research, or persons associated with or connected to Phillip Securities Research, including but not limited to its officers, directors, employees or persons involved in the issuance of this report, may have participated in or invested in transactions with the issuer(s) of the securities mentioned in this report, and may have performed services for or solicited business from such issuers. Additionally, Phillip Securities Research, or persons associated with or connected to Phillip Securities Research, including but not limited to its officers, directors, employees or persons involved in the issuance of this report, may have provided advice or investment services to such companies and investments or related investments, as may be mentioned in this report.
Phillip Securities Research or persons associated with or connected to Phillip Securities Research, including but not limited to its officers, directors, employees or persons involved in the issuance of this report may, from time to time maintain a long or short position in securities referred to herein, or in related futures or options, purchase or sell, make a market in, or engage in any other transaction involving such securities, and earn brokerage or other compensation in respect of the foregoing. Investments will be denominated in various currencies including US dollars and Euro and thus will be subject to any fluctuation in exchange rates between US dollars and Euro or foreign currencies and the currency of your own jurisdiction. Such fluctuations may have an adverse effect on the value, price or income return of the investment.
To the extent permitted by law, Phillip Securities Research, or persons associated with or connected to Phillip Securities Research, including but not limited to its officers, directors, employees or persons involved in the issuance of this report, may at any time engage in any of the above activities as set out above or otherwise hold an interest, whether material or not, in respect of companies and investments or related investments, which may be mentioned in this report. Accordingly, information may be available to Phillip Securities Research, or persons associated with or connected to Phillip Securities Research, including but not limited to its officers, directors, employees or persons involved in the issuance of this report, which is not reflected in this report, and Phillip Securities Research, or persons associated with or connected to Phillip Securities Research, including but not limited to its officers, directors, employees or persons involved in the issuance of this report, may, to the extent permitted by law, have acted upon or used the information prior to or immediately following its publication. Phillip Securities Research, or persons associated with or connected to Phillip Securities Research, including but not limited its officers, directors, employees or persons involved in the issuance of this report, may have issued other material that is inconsistent with, or reach different conclusions from, the contents of this report.
The information, tools and material presented herein are not directed, intended for distribution to or use by, any person or entity in any jurisdiction or country where such distribution, publication, availability or use would be contrary to the applicable law or regulation or which would subject Phillip Securities Research to any registration or licensing or other requirement, or penalty for contravention of such requirements within such jurisdiction.
This report is intended for general circulation only and does not take into account the specific investment objectives, financial situation or particular needs of any particular person. The products mentioned in this report may not be suitable for all investors and a person receiving or reading this report should seek advice from a professional and financial adviser regarding the legal, business, financial, tax and other aspects including the suitability of such products, taking into account the specific investment objectives, financial situation or particular needs of that person, before making a commitment to invest in any of such products.
This report is not intended for distribution, publication to or use by any person in any jurisdiction outside of Singapore or any other jurisdiction as Phillip Securities Research may determine in its absolute discretion.
IMPORTANT DISCLOSURES FOR INCLUDED RESEARCH ANALYSES OR REPORTS OF FOREIGN RESEARCH HOUSE
Where the report contains research analyses or reports from a foreign research house, please note:
