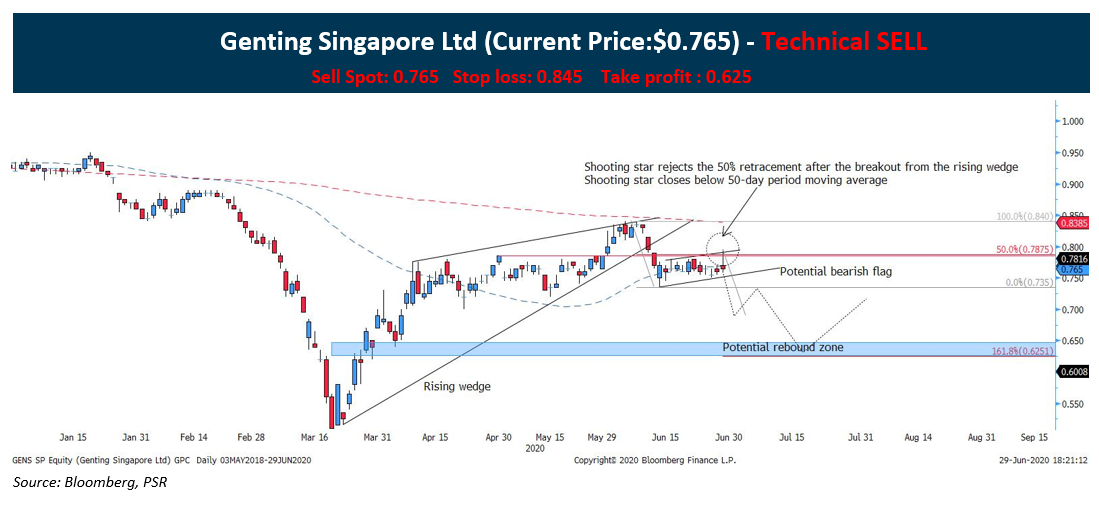
Genting Singapore (SGX: G13) has broken below the support turned resistance level at $0.785 based on our report dated 11th June 2020. We are still maintaining our short position on our previous report based and revise our new target price to $0.625 based on our updated Fibonacci expansion level of $0.735-$0.840:
- Genting did have a slight retracement on 12th June Friday after breaking out of the rising wedge formation. Despite a strong bullish upside on 12th June, the subsequent price momentum shows a slew of smaller candle bodies which indicate that the rebound is corrective rather than a reversal.
- The potential bearish flag formation indicate that the stock is getting ready to break below.
- The formation of the shooting star rejecting 50% Fibonacci retracement level of $0.735-$0.840 indicate a strong selling at that level. To add on, the 50% retracement level was the previous support turned resistance level.
- The body of the shooting star actually closes below the 50-day period moving average. This shows that the trend is starting to reverse to the downside.
*Timeline of the trade should be between 1-3 weeks from the date issued.
* The support between $0.700-%0.720 remain a key support zone. Breaking it wills see price travel further to $0.625.
CHART LEGENDS
Moving average
Red dotted line = 200 periods Moving average
Blue dotted line = 50 periods Moving average