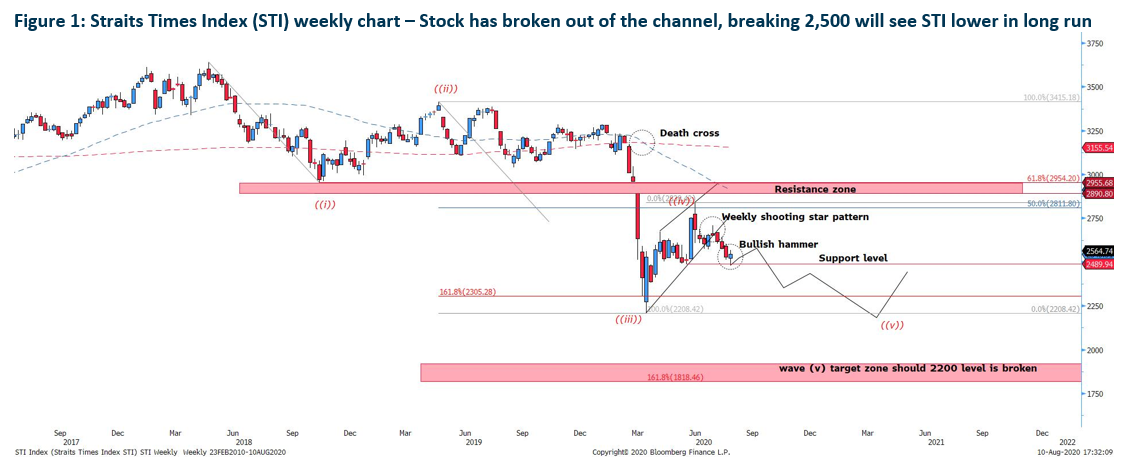
On 6th of July, we expected the Straits Time Index to make one last rally to test the resistance zone between 2,900 and 2,954 provided the 50% Fibonacci is broken. However, this action fails to materialise. Although the index did make some up move in response to the bullish engulfing candle, the stock swiftly reverse downward by forming a shooting star and broke below the flag, signify a bearish downside will continue. However, the stock has not break below 2,500 to form a lower low and instead, it shows a slight bullish candle which resemble a bullish hammer above 2,500 psychological support level.
In order for the STI to reverse upwards, the next level at 2573.51 needs to break upward with a stronger momentum, otherwise the move will be considered corrective and the stock will resume its downside.
Mid-Term target of the STI remains at 2,208.42.
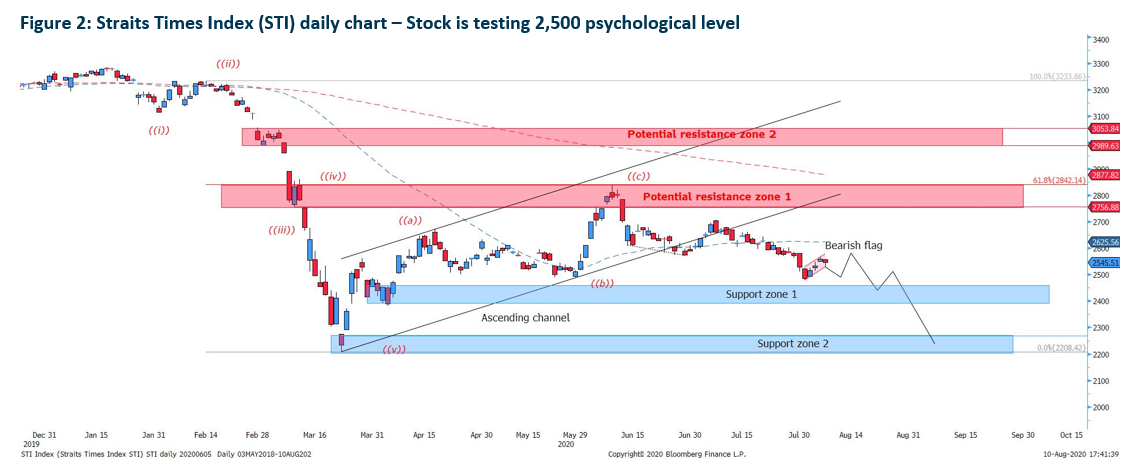
The daily chart of the STI shows a clearer picture, Although the first 4 days of the STI is on a rallying mode, the crucial Friday’s candle fails to close above the Thursday’s high at 2,566.70. Zooming in, the STI’s up move last week has actually form a smaller flag which indicate an incoming correction ahead.
Moving forward, the stock will likely test the immediate high again at 2,600 region before a sell down to test support zone 1. Longer term rebound is at support zone 2,208.42-2,263.00.
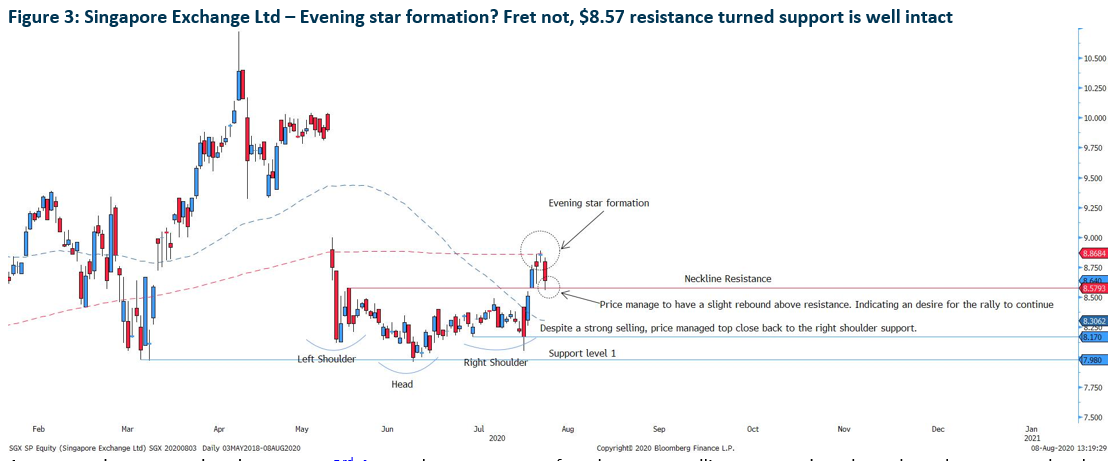
As expected on our updated report on 3rd August has come true after the strong selling managed to close above key support level at $8.17 at the last hour. As the stock has broken out of the neckline resistance of the inverted head and shoulder, the mid-term Bull Run will continue even though there is a strong bearish contender by forming an evening star formation.
Even though the evening star poses a threat after the 2nd candle rejected the 200-day moving average which increase the risk to reverse to the downside, we are holding on to our target price based on our report on 24th July at $9.23. First, the occurrence of pull-back happens almost 67% of the time after a breakout of the head and shoulder pattern. Secondly, the bearish candle fails to close below the neckline at the last hour of trading last Friday. As such, the stock’s bullish sentiment remains.
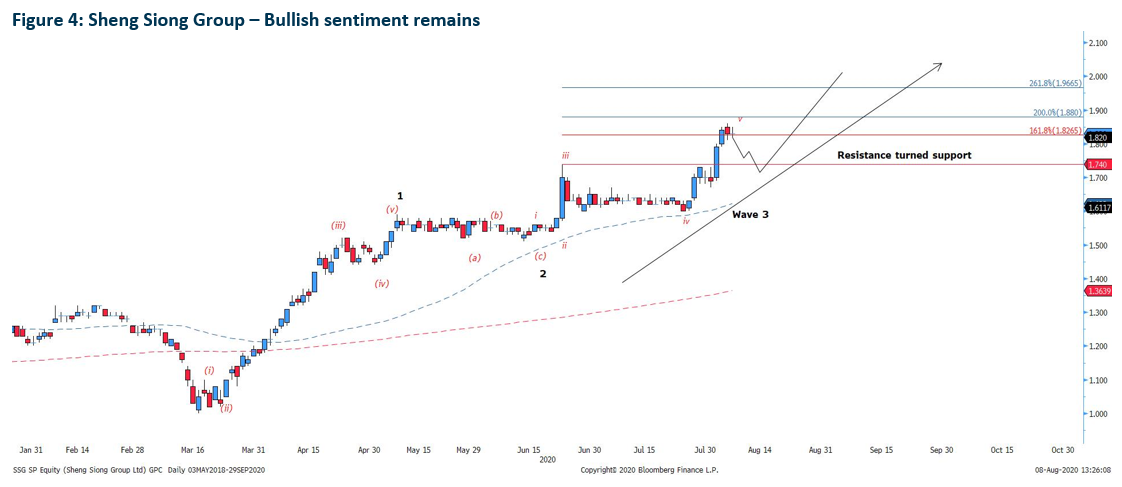
Our report dated 4th August indicated a strong probability of a correction but it fails to materialise. As such, the wave count has changed and we are looking at a wave 3 forming on a longer time period basis.
After the stock broke out of the resistance on 5th August, the stock has made a new high. However, zooming in on the sub-wave count, the i-v sub-wave of wave 3 has already being completed and we are looking at a minor correction should the stock fails to break above $1.88. Potential rebound is near $1.74, which is the resistance turned support level.
Long term target price is at $2.00.
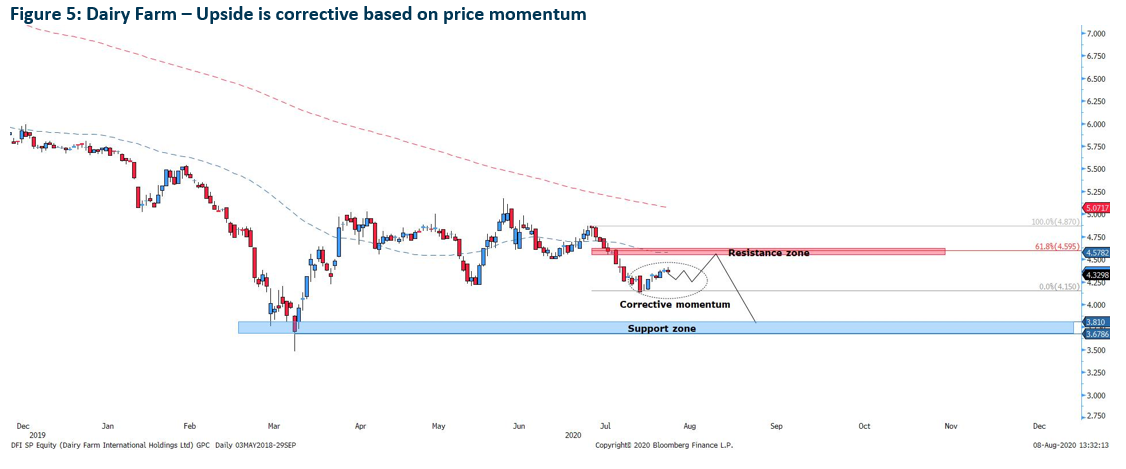
Dairy farm bullish momentum was hopeful when the Morning Star formation was continued after prices continue its upside based on our report on 3rd August. Despite successive upside, the momentum remain week after two pin bars appeared on Thursday and Friday. As such, we have revised our target price lower to $4.55-$4.59 resistance zone.
The next potential strong rebound is at the support zone of $3.67-$3.81.
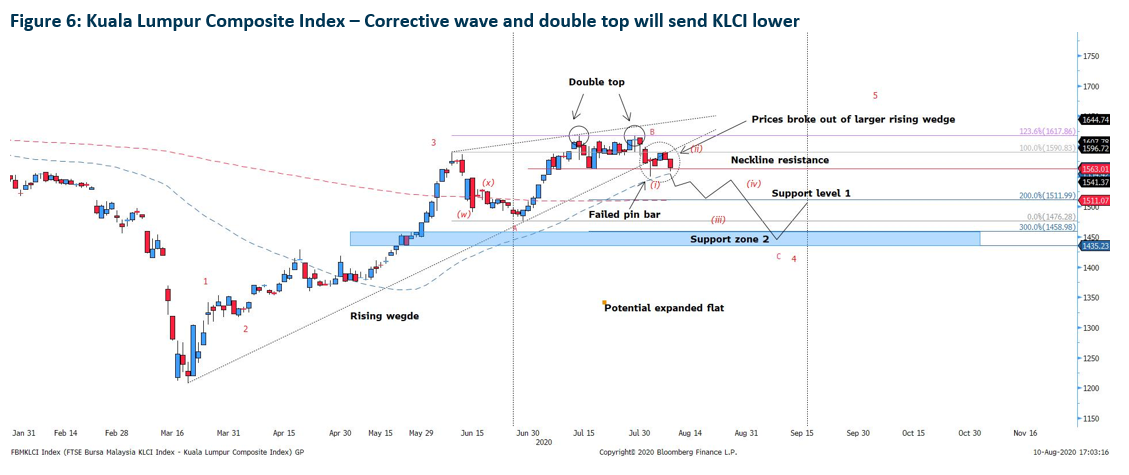
The KLCI had a stellar rally in mid-March 2020 after a strong sell down in February 2020. However, the rally was very much in a corrective phase after prices broke out of the rising wedge formation recently. Zooming in, the stock also made smaller double top within the wedge and prices has tried to break below the neckline resistance of 1,563.01. Judging from the Fibonacci extension levels of the double top, we are looking at 2 possible rebound level, namely at 1,511.99 and 1,435.23-1,458.98.
Diving into the wave analysis, the stock has completed 3 impulse wave and since 1st July onwards, KLCI has been on a corrective wave 4 with a potential expanded flat in the making. As such, the potential rebound of the sub-c wave of the potential expanded flat confluence with the support zone 2 which we’ve highlighted earlier on.
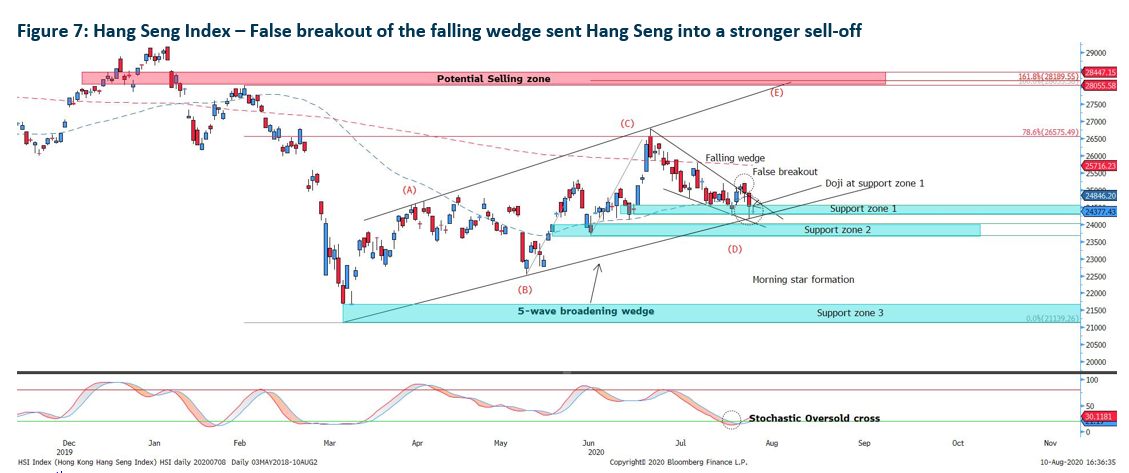
On 5th August, we issued a bullish call on the Hang Seng after a morning star formation was spotted. Indeed the price made an attempt to rally but on last Thursday, the formation of a bearish engulfing candle indicate that the breakout of the falling wedge was a false one. Friday saw the most ferocious sell-off and although the pull-back above the upper trench of the support zone at 24,558.00, Monday’s price momentum saw prices gapping lower with the candle closing off at a doji within the support zone, citing indecision.
Moving forward, the Hang Seng will try to move upwards again but the upside may be limited as first the support zone 2 highlighted at 23,705.00-24,000.00 is a much more attractive level to stage a rebound.
Should prices break support zone 2, the whole 5-wave expanding/broadening wedge will be invalidated. Prices will then test the lower level at support zone 3 at 21,693.50-21,139.26.
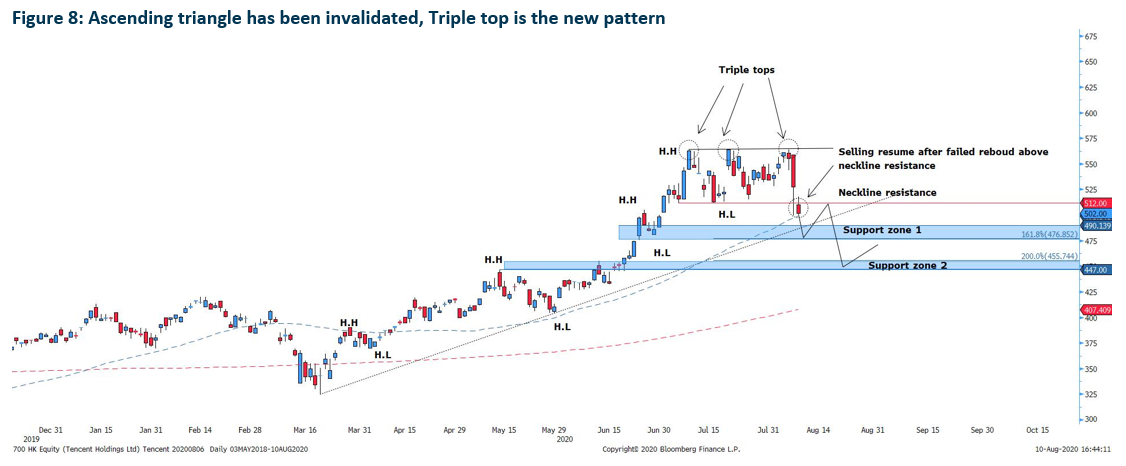
We had a strong conviction that Tencent will make an attempt to push prices higher with the ascending triangle formation in place which we mentioned on our report on 6th August. However, the strong sell-off on Friday has invalidate the ascending triangle and formed a triple top formation instead after prices breaks below the neckline resistance at $512.00 on Monday 10th August.
Based on the Fibonacci extension level of the triple top pattern, the likely rebound will be at support zone 1 which stands at $476.85-$490.13 and support zone 2 at $447.00-$455.74. Which is also the 161.8% and 200.0% extension level respectively.
Important Information
This report is prepared and/or distributed by Phillip Securities Research Pte Ltd ("Phillip Securities Research"), which is a holder of a financial adviser’s licence under the Financial Advisers Act, Chapter 110 in Singapore.
By receiving or reading this report, you agree to be bound by the terms and limitations set out below. Any failure to comply with these terms and limitations may constitute a violation of law. This report has been provided to you for personal use only and shall not be reproduced, distributed or published by you in whole or in part, for any purpose. If you have received this report by mistake, please delete or destroy it, and notify the sender immediately.
The information and any analysis, forecasts, projections, expectations and opinions (collectively, the “Research”) contained in this report has been obtained from public sources which Phillip Securities Research believes to be reliable. However, Phillip Securities Research does not make any representation or warranty, express or implied that such information or Research is accurate, complete or appropriate or should be relied upon as such. Any such information or Research contained in this report is subject to change, and Phillip Securities Research shall not have any responsibility to maintain or update the information or Research made available or to supply any corrections, updates or releases in connection therewith.
Any opinions, forecasts, assumptions, estimates, valuations and prices contained in this report are as of the date indicated and are subject to change at any time without prior notice. Past performance of any product referred to in this report is not indicative of future results.
This report does not constitute, and should not be used as a substitute for, tax, legal or investment advice. This report should not be relied upon exclusively or as authoritative, without further being subject to the recipient’s own independent verification and exercise of judgment. The fact that this report has been made available constitutes neither a recommendation to enter into a particular transaction, nor a representation that any product described in this report is suitable or appropriate for the recipient. Recipients should be aware that many of the products, which may be described in this report involve significant risks and may not be suitable for all investors, and that any decision to enter into transactions involving such products should not be made, unless all such risks are understood and an independent determination has been made that such transactions would be appropriate. Any discussion of the risks contained herein with respect to any product should not be considered to be a disclosure of all risks or a complete discussion of such risks.
Nothing in this report shall be construed to be an offer or solicitation for the purchase or sale of any product. Any decision to purchase any product mentioned in this report should take into account existing public information, including any registered prospectus in respect of such product.
Phillip Securities Research, or persons associated with or connected to Phillip Securities Research, including but not limited to its officers, directors, employees or persons involved in the issuance of this report, may provide an array of financial services to a large number of corporations in Singapore and worldwide, including but not limited to commercial / investment banking activities (including sponsorship, financial advisory or underwriting activities), brokerage or securities trading activities. Phillip Securities Research, or persons associated with or connected to Phillip Securities Research, including but not limited to its officers, directors, employees or persons involved in the issuance of this report, may have participated in or invested in transactions with the issuer(s) of the securities mentioned in this report, and may have performed services for or solicited business from such issuers. Additionally, Phillip Securities Research, or persons associated with or connected to Phillip Securities Research, including but not limited to its officers, directors, employees or persons involved in the issuance of this report, may have provided advice or investment services to such companies and investments or related investments, as may be mentioned in this report.
Phillip Securities Research or persons associated with or connected to Phillip Securities Research, including but not limited to its officers, directors, employees or persons involved in the issuance of this report may, from time to time maintain a long or short position in securities referred to herein, or in related futures or options, purchase or sell, make a market in, or engage in any other transaction involving such securities, and earn brokerage or other compensation in respect of the foregoing. Investments will be denominated in various currencies including US dollars and Euro and thus will be subject to any fluctuation in exchange rates between US dollars and Euro or foreign currencies and the currency of your own jurisdiction. Such fluctuations may have an adverse effect on the value, price or income return of the investment.
To the extent permitted by law, Phillip Securities Research, or persons associated with or connected to Phillip Securities Research, including but not limited to its officers, directors, employees or persons involved in the issuance of this report, may at any time engage in any of the above activities as set out above or otherwise hold an interest, whether material or not, in respect of companies and investments or related investments, which may be mentioned in this report. Accordingly, information may be available to Phillip Securities Research, or persons associated with or connected to Phillip Securities Research, including but not limited to its officers, directors, employees or persons involved in the issuance of this report, which is not reflected in this report, and Phillip Securities Research, or persons associated with or connected to Phillip Securities Research, including but not limited to its officers, directors, employees or persons involved in the issuance of this report, may, to the extent permitted by law, have acted upon or used the information prior to or immediately following its publication. Phillip Securities Research, or persons associated with or connected to Phillip Securities Research, including but not limited its officers, directors, employees or persons involved in the issuance of this report, may have issued other material that is inconsistent with, or reach different conclusions from, the contents of this report.
The information, tools and material presented herein are not directed, intended for distribution to or use by, any person or entity in any jurisdiction or country where such distribution, publication, availability or use would be contrary to the applicable law or regulation or which would subject Phillip Securities Research to any registration or licensing or other requirement, or penalty for contravention of such requirements within such jurisdiction.
This report is intended for general circulation only and does not take into account the specific investment objectives, financial situation or particular needs of any particular person. The products mentioned in this report may not be suitable for all investors and a person receiving or reading this report should seek advice from a professional and financial adviser regarding the legal, business, financial, tax and other aspects including the suitability of such products, taking into account the specific investment objectives, financial situation or particular needs of that person, before making a commitment to invest in any of such products.
This report is not intended for distribution, publication to or use by any person in any jurisdiction outside of Singapore or any other jurisdiction as Phillip Securities Research may determine in its absolute discretion.
IMPORTANT DISCLOSURES FOR INCLUDED RESEARCH ANALYSES OR REPORTS OF FOREIGN RESEARCH HOUSE
Where the report contains research analyses or reports from a foreign research house, please note:
