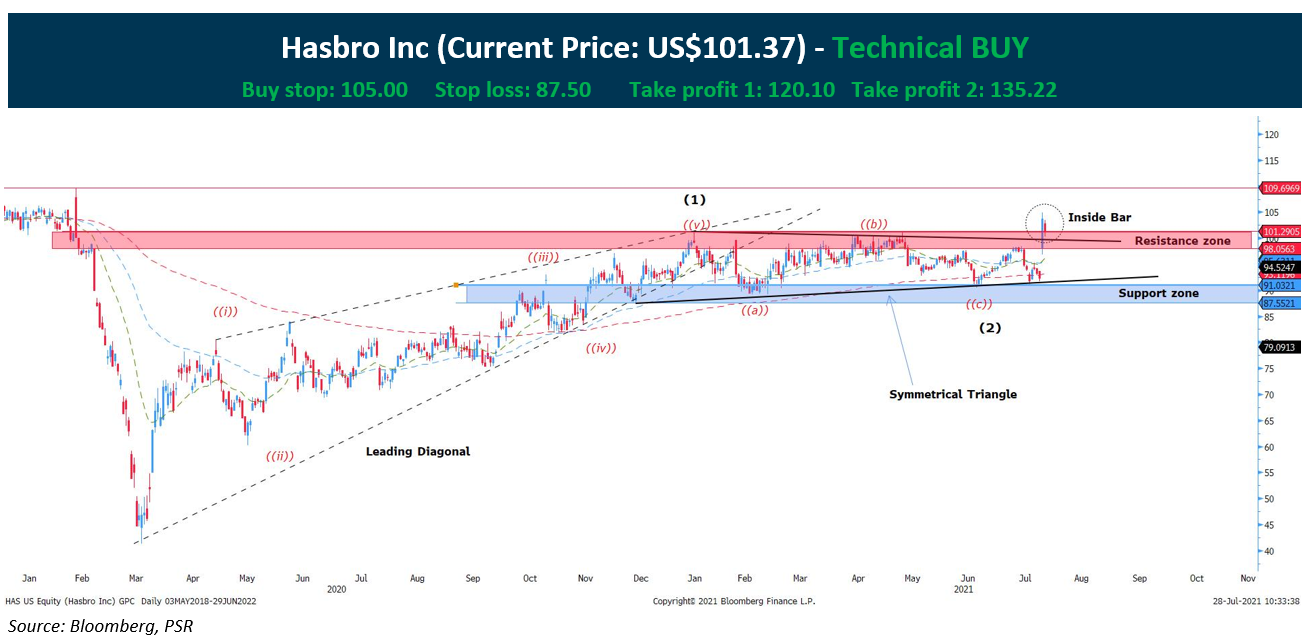
Hasbro Inc (US: HAS) upside is set to continue after wave and technical indicate that the upside is yet to complete:
- The Elliott wave count suggest that after completing wave (1) of the leading diagonal wave and wave (2) of the symmetrical triangle, the upside for wave (3) is set to continue after a strong bullish gap up and close above the resistance zone of 98.05-101.29. Indicating the resumption of the uptrend.
- The inside bar on Tuesday is a sign of consolidation and should it break above the US$105.00 psychological resistance level, it will confirm the upside.
- Monday’s strong gap up above the 63 and 22-day exponential moving average indicate short and mid-term resumption of the upside.
- By breaking US$109.66 resistance level, there will be added confirmation to the bullish upside.
*Expected timeline of the trade is 12 weeks from the date of report issuance.
CHART LEGEND
Moving Average
Red dotted line = 200 periods MA
Blue dotted line = 63 periods MA
Green dotted line = 22 periods MA
