
March was another disappointing month as the Straits Times Index (STI) failed to follow through with bullish momentum from the last two weeks of February. As a result, the STI was down -2.56% in March mainly caused by the general risk-off sentiment across the world.
The main highlight in March that sparked the risk-off sentiment was the harsh trade war talks between US and China. As soon as the US fired the first warning shot on 9 March, where president Trump imposed tariffs on Steel and Aluminium at 25% and 10% respectively, the S&P 500 index formed a top shortly after and rolled over into a severe selloff. Since the announcement of the Steel and Aluminium tariffs, the S&P 500 index has fallen as much as -7%. The contagion effect also dragged the rest of the global equity market down along with it including the STI but to a lesser extent.
However, we do not expect the current risk-off sentiment to stay as our “Phillip Recession Tracker” still signals for a bullish outlook as 14 out of 15 recession indicators have yet to trigger their bearish signal.
From a longer-term price action perspective, the general risk-off sentiment has dragged the STI into a prolonged correction that began in January, but the long-term uptrend remains intact. Even with the severe correction of –7.5% off the 3,611 high in February, the STI managed to keep the structure of the uptrend in place as it continues to form a series of Higher Highs (HH) and Higher Lows (HL). More importantly, the 3,354 to 3,340 support area needs to hold for the uptrend to regain strength.
On the weekly timeframe, the 3,354 to 3,340 support area held up once again for the week ended 06/04/18 proving the significance of the support area. Moreover, the strong bullish rejection resulted in price forming a hammer suggests a possible reversal higher back into the uptrend. Further clues of bullishness can be seen when the STI closes back above the 20 week moving average.
STI Weekly Chart – hammer rejection off the 3,354 – 3,340 support area suggests a rebound higher
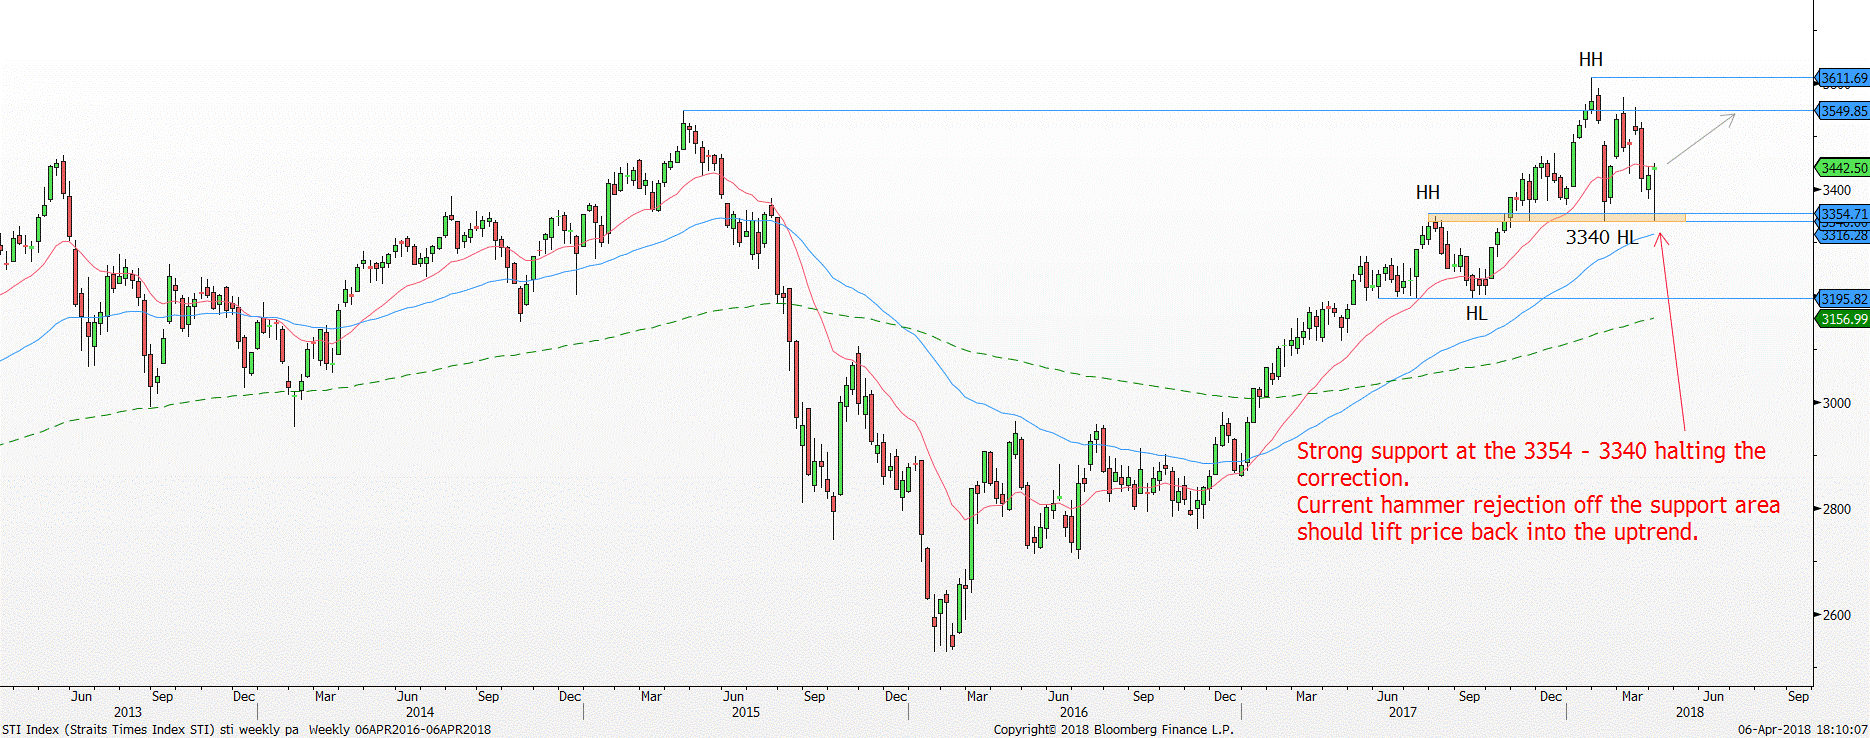
Source: Bloomberg, PSR
Red line = 20 period moving average, Blue line = 60 period moving average, Green line = 200 period moving average
Overall, the “Phillip 20 Portfolio” was also affected by the depressing price action. The “Phillip 20 Portfolio” was down -0.83% while the STI was down -2.56% in March.

Losers
Unfortunately, both F&N and Wing Tai were stopped out in March due to the depressing price action from the general risk-off sentiment.
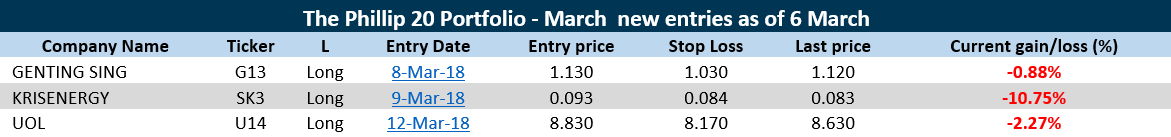
New Entries
With the dull movement in the broad-based market in March, only three new trades were taken shown in the following table.
Note: The March new entries of KrisEnergy and Genting Sing have hit their respective stop loss resulting in -9.68% and – 8.85% loss to the portfolio. Average loss from these trades were -0.92%.
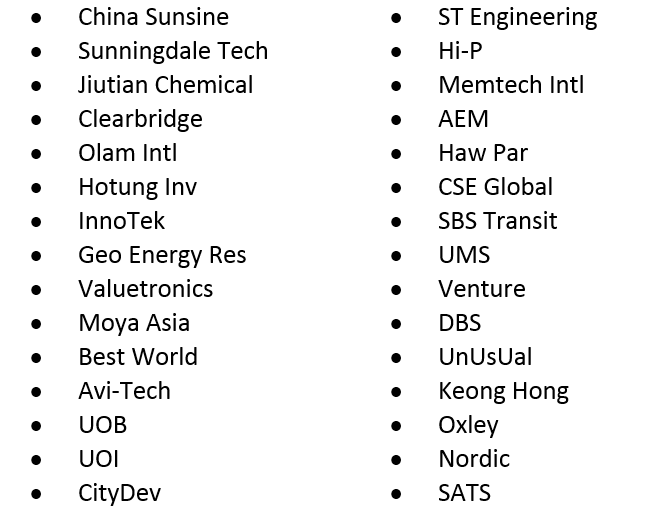
Watchlist
After a major reshuffling of the portfolio, there are currently 14 stocks within the “Phillip 20 Portfolio.” The following is the revised watch list that we are closely monitoring:
Important Information
This report is prepared and/or distributed by Phillip Securities Research Pte Ltd ("Phillip Securities Research"), which is a holder of a financial adviser’s licence under the Financial Advisers Act, Chapter 110 in Singapore.
By receiving or reading this report, you agree to be bound by the terms and limitations set out below. Any failure to comply with these terms and limitations may constitute a violation of law. This report has been provided to you for personal use only and shall not be reproduced, distributed or published by you in whole or in part, for any purpose. If you have received this report by mistake, please delete or destroy it, and notify the sender immediately.
The information and any analysis, forecasts, projections, expectations and opinions (collectively, the “Research”) contained in this report has been obtained from public sources which Phillip Securities Research believes to be reliable. However, Phillip Securities Research does not make any representation or warranty, express or implied that such information or Research is accurate, complete or appropriate or should be relied upon as such. Any such information or Research contained in this report is subject to change, and Phillip Securities Research shall not have any responsibility to maintain or update the information or Research made available or to supply any corrections, updates or releases in connection therewith.
Any opinions, forecasts, assumptions, estimates, valuations and prices contained in this report are as of the date indicated and are subject to change at any time without prior notice. Past performance of any product referred to in this report is not indicative of future results.
This report does not constitute, and should not be used as a substitute for, tax, legal or investment advice. This report should not be relied upon exclusively or as authoritative, without further being subject to the recipient’s own independent verification and exercise of judgment. The fact that this report has been made available constitutes neither a recommendation to enter into a particular transaction, nor a representation that any product described in this report is suitable or appropriate for the recipient. Recipients should be aware that many of the products, which may be described in this report involve significant risks and may not be suitable for all investors, and that any decision to enter into transactions involving such products should not be made, unless all such risks are understood and an independent determination has been made that such transactions would be appropriate. Any discussion of the risks contained herein with respect to any product should not be considered to be a disclosure of all risks or a complete discussion of such risks.
Nothing in this report shall be construed to be an offer or solicitation for the purchase or sale of any product. Any decision to purchase any product mentioned in this report should take into account existing public information, including any registered prospectus in respect of such product.
Phillip Securities Research, or persons associated with or connected to Phillip Securities Research, including but not limited to its officers, directors, employees or persons involved in the issuance of this report, may provide an array of financial services to a large number of corporations in Singapore and worldwide, including but not limited to commercial / investment banking activities (including sponsorship, financial advisory or underwriting activities), brokerage or securities trading activities. Phillip Securities Research, or persons associated with or connected to Phillip Securities Research, including but not limited to its officers, directors, employees or persons involved in the issuance of this report, may have participated in or invested in transactions with the issuer(s) of the securities mentioned in this report, and may have performed services for or solicited business from such issuers. Additionally, Phillip Securities Research, or persons associated with or connected to Phillip Securities Research, including but not limited to its officers, directors, employees or persons involved in the issuance of this report, may have provided advice or investment services to such companies and investments or related investments, as may be mentioned in this report.
Phillip Securities Research or persons associated with or connected to Phillip Securities Research, including but not limited to its officers, directors, employees or persons involved in the issuance of this report may, from time to time maintain a long or short position in securities referred to herein, or in related futures or options, purchase or sell, make a market in, or engage in any other transaction involving such securities, and earn brokerage or other compensation in respect of the foregoing. Investments will be denominated in various currencies including US dollars and Euro and thus will be subject to any fluctuation in exchange rates between US dollars and Euro or foreign currencies and the currency of your own jurisdiction. Such fluctuations may have an adverse effect on the value, price or income return of the investment.
To the extent permitted by law, Phillip Securities Research, or persons associated with or connected to Phillip Securities Research, including but not limited to its officers, directors, employees or persons involved in the issuance of this report, may at any time engage in any of the above activities as set out above or otherwise hold an interest, whether material or not, in respect of companies and investments or related investments, which may be mentioned in this report. Accordingly, information may be available to Phillip Securities Research, or persons associated with or connected to Phillip Securities Research, including but not limited to its officers, directors, employees or persons involved in the issuance of this report, which is not reflected in this report, and Phillip Securities Research, or persons associated with or connected to Phillip Securities Research, including but not limited to its officers, directors, employees or persons involved in the issuance of this report, may, to the extent permitted by law, have acted upon or used the information prior to or immediately following its publication. Phillip Securities Research, or persons associated with or connected to Phillip Securities Research, including but not limited its officers, directors, employees or persons involved in the issuance of this report, may have issued other material that is inconsistent with, or reach different conclusions from, the contents of this report.
The information, tools and material presented herein are not directed, intended for distribution to or use by, any person or entity in any jurisdiction or country where such distribution, publication, availability or use would be contrary to the applicable law or regulation or which would subject Phillip Securities Research to any registration or licensing or other requirement, or penalty for contravention of such requirements within such jurisdiction.
This report is intended for general circulation only and does not take into account the specific investment objectives, financial situation or particular needs of any particular person. The products mentioned in this report may not be suitable for all investors and a person receiving or reading this report should seek advice from a professional and financial adviser regarding the legal, business, financial, tax and other aspects including the suitability of such products, taking into account the specific investment objectives, financial situation or particular needs of that person, before making a commitment to invest in any of such products.
This report is not intended for distribution, publication to or use by any person in any jurisdiction outside of Singapore or any other jurisdiction as Phillip Securities Research may determine in its absolute discretion.
IMPORTANT DISCLOSURES FOR INCLUDED RESEARCH ANALYSES OR REPORTS OF FOREIGN RESEARCH HOUSE
Where the report contains research analyses or reports from a foreign research house, please note:

Jeremy specialises in Technical Analysis and has 10 years of experience in studying price action. His areas of expertise include intermarket analysis on the equities, currencies, commodities and bonds market.
He is also a regular columnist on The Business Times - every Monday ChartPoint column.
He graduated with a Bachelor of Science in Banking and Finance from University of London.
