
April was a remarkable month for the Singapore equity market as the STI was up a whopping +5.4%. To put things into context, the S&P 500 index was up marginally by +0.40% while the Hang Seng Index gained +2.38% in April. The main mover that lifted the STI higher was the banking sector with DBS, OCBC and UOB rallying +12.15%, +10.34% and +7.64% in April.
All in, with the sharp rise in price action in April, we expect to see some near-term correction in the STI as the current price action is showing some weakness at the 3611 resistance area, which was the January 2018 high. Following up from the March monthly review, the STI rebounded off perfectly the 3354 support area with the hammer rejection bar on the week ended 18 April. After the bullish price action was confirmed, the uptrend resumed as expected and brought the STI back up to retest the key resistance area at 3611 points.
However, on the daily timeframe, the STI is exhibiting some sign of weakness lately as the 3611 resistance area tries to put a cap on the bullish momentum. The buyers successfully closed price above the 3611 resistance area since 30 April, but the follow through was rather weak. Since then, the STI has rolled back below the 3611 resistance area suggesting a correction is happening.
Moreover, the Relative Strength Index (RSI) has also recently hit a high of 66 on 2 May signalling for a mean reversion lower. RSI measures momentum. An RSI reading above 70 represents overbought condition while an RSI reading below 30 represents oversold condition. With the past few days of selling, it appears that the RSI is currently in the midst of a mean reversion where a correction lower in the STI is expected.
For the next correction, we expect the STI to retrace to the 60-day moving average at 3500 points first before possibly seeing the resumption of the uptrend as the market rebalances. The next leg up will have the bulls targeting the 3688 resistance area followed by the 3700 psychological round number.
STI Daily Chart – Facing some near-term resistance at 3611 points
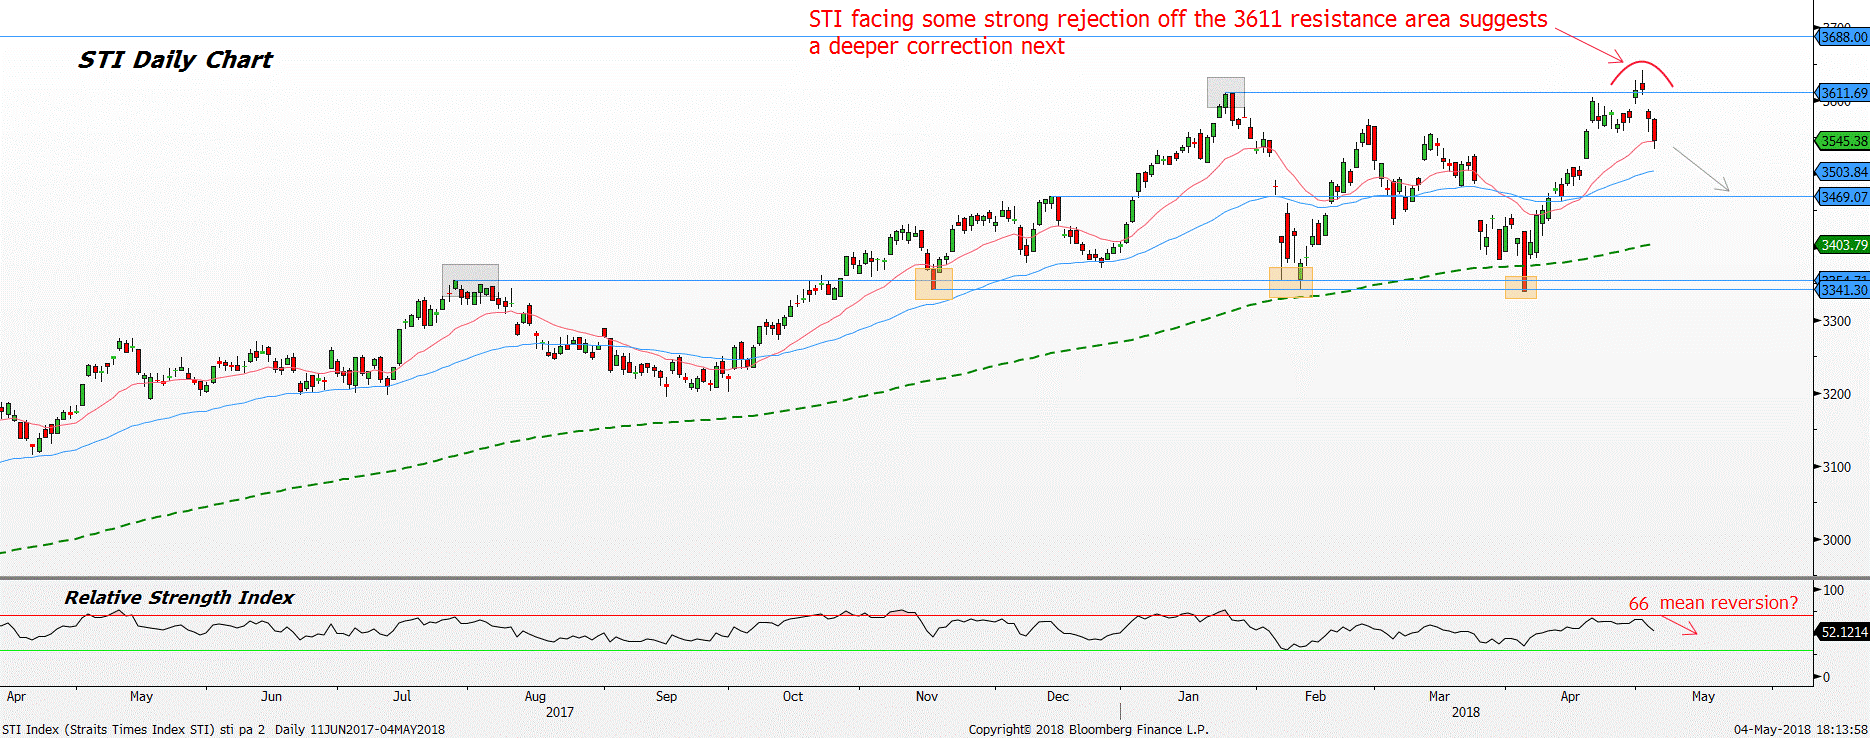
Source: Bloomberg, PSR
Red line = 20 period moving average, Blue line = 60 period moving average, Green line = 200 period moving average
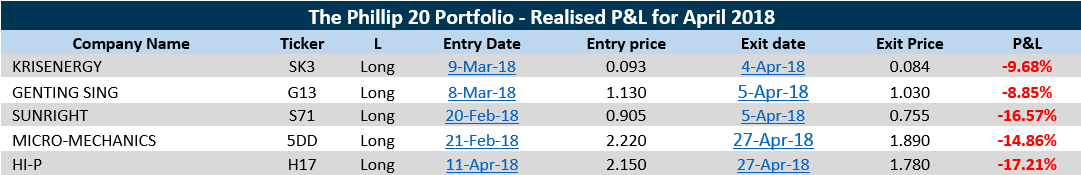
Unfortunately, the “Phillip 20 Portfolio “did not perform as positively as the STI. The “Phillip 20 Portfolio” was affected mainly by the Tech selloff in April resulting in a couple of the momentum stocks within the Portfolio hitting their stop losses. The “Phillip 20 portfolio” was down –0.73% in April as compared to the STI of +5.4%.

Jeremy specialises in Technical Analysis and has 10 years of experience in studying price action. His areas of expertise include intermarket analysis on the equities, currencies, commodities and bonds market.
He is also a regular columnist on The Business Times - every Monday ChartPoint column.
He graduated with a Bachelor of Science in Banking and Finance from University of London.
