
Green line = 200 week moving average
STI Weekly Chart Source: Bloomberg, PSR
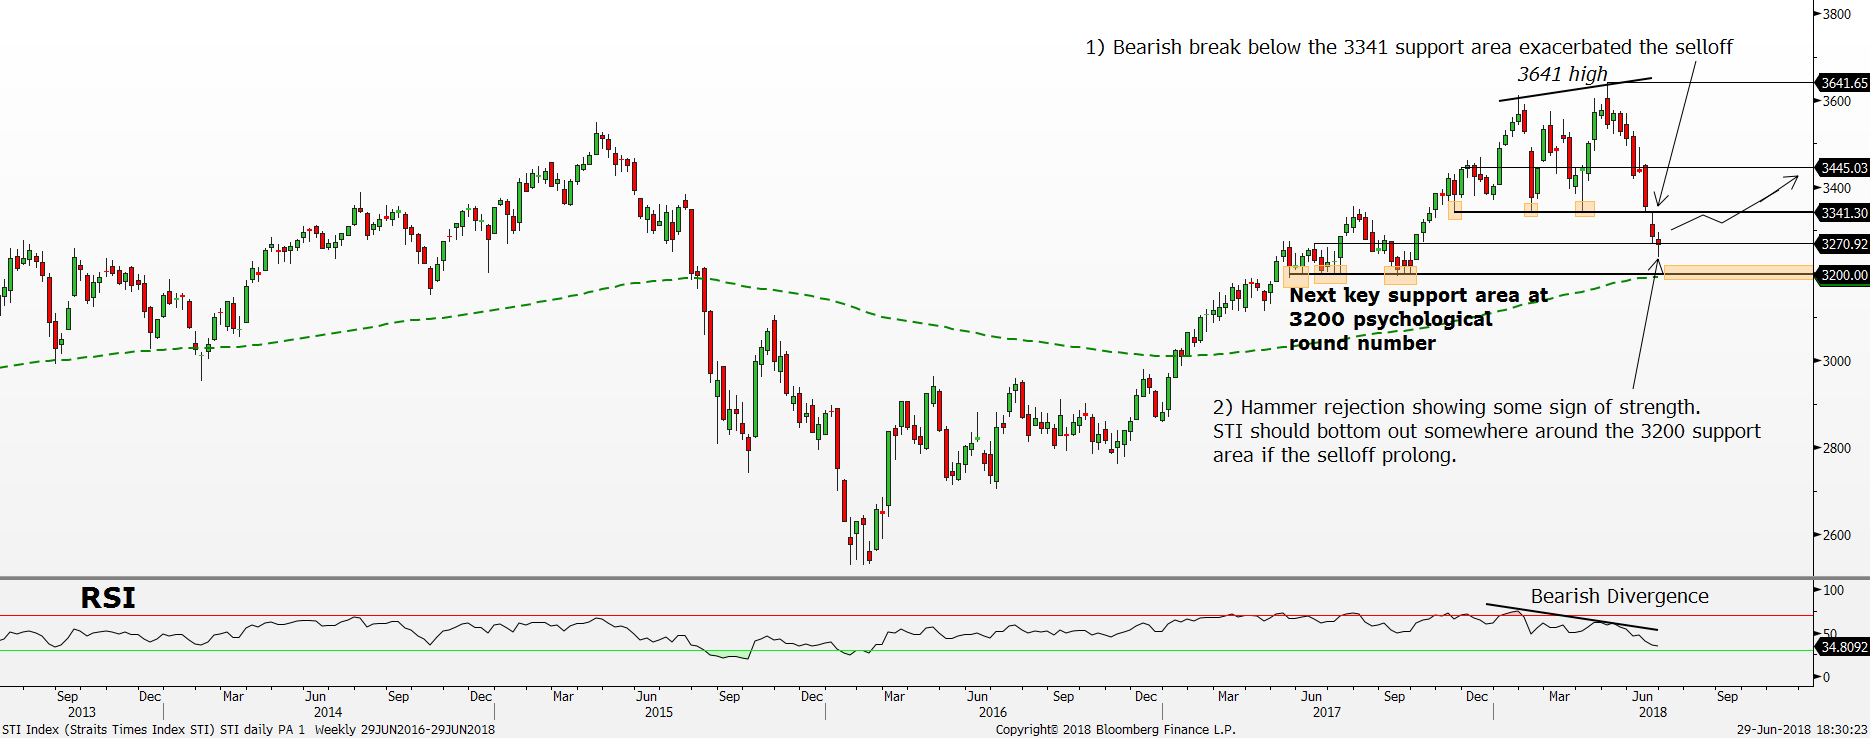
Since hitting a high of 3641 points in late April 2018, the Straits Times Index (STI) has fallen around -10% into a new downtrend. The bearish move was mainly sparked by the Weekly Bearish Engulfing Bar rejection off the 3611 resistance area and the weekly RSI bearish divergence formation in the week ended 4 May 2018. Instead of seeing some rebound near the crucial 3341 support area, the bears were relentless this time as they succeeded in breaking below it.
The 3341 support area is particularly important because it has been holding the uptrend intact since November 2017 and had successfully reversed major selloffs on three separate occasions shown by the highlighted boxes. However, as the bears break below the 3341 support area, the selloff exacerbated as the sell stops get taken out. Most long speculators would have hidden their stop losses just below the 3341 support area thus resulting in the sharper selloff after price broke below the 3341 area.
The immediate trend has turned bearish with the recent bearish break below the 3341 Higher Low point. Thus, the next closely watched area for a possible rebound is the 3200 support area. The 3200 support area is an important point of interest as it has been a solid floor for the STI in May 2017 to September 2017 shown by the highlighted boxes. There were more bullish rejections around the 3200 psychological round number justifying the significance of that area. Moreover, 200-week moving average also coincides with the 3200 support area adding more weight to it.
Do note that the daily Relative Strength Index (RSI) is also currently in the oversold condition. RSI measures momentum. A reading above 70 represents overbought condition while a reading below 30 represents oversold condition. With the rise in the bearish momentum lately, the RSI has also hit an extreme low of 23 in late June suggesting for an imminent correction soon. The confirmation of the correction could be seen when the RSI rises back above the 30 oversold level. Historically, when the RSI dives into the oversold territory, a mean reversion higher tends to happen together with a rebound higher in the STI. Our historical study shows an average rebound of +5% after the oversold RSI mean reversion signal is confirmed.
Therefore, looking at last Friday’s close shows a possibility of the beginning of the oversold RSI mean reversion as the RSI managed to close at 30. Watch out for the bullish move to sustain and for a bullish follow-through above the 3300 psychological round number for the STI to establish a near-term base. A 5% recovery from here would suggest a retest of the 3450 resistance area.
In summary, the STI appears to have limited downside in the near term with the current oversold condition. Moreover, the confluence of support at the 200-week moving average and 3200 psychological round number should provide a near-term floor if the selloff prolong.

Jeremy specialises in Technical Analysis and has 10 years of experience in studying price action. His areas of expertise include intermarket analysis on the equities, currencies, commodities and bonds market.
He is also a regular columnist on The Business Times - every Monday ChartPoint column.
He graduated with a Bachelor of Science in Banking and Finance from University of London.
