
Company snapshot
Sembcorp Industries Ltd (SCI) is an investment holding company, engaged in utilities, marine, and urban development globally. The utilities segment provides various kinds of energy and water treatment to industrial, commercial, and municipal end-users. The marine segment provides integrated engineering solutions for offshore and marine industry. The urban development is involved in land and property development. In Apr-17, new group president & CEO, Neil McGregor, was on board, and he delivered the message to shareholders that a strategic review will be conducted this year.
Investment Merits
Investment Actions
We initiate SCI with an Accumulate rating and a target price of $3.50. This implies an upside of 13.7% (including forecast dividends of 8 SG cents) from the last closing price of S$3.15. Our SOTP valuation of SCI is after a 10% conglomerate discount.
Company Background
Figure 1: Revenue segmental breakdown in percentage
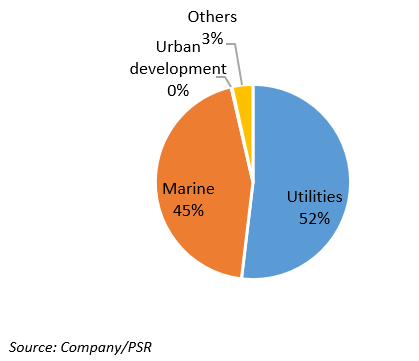
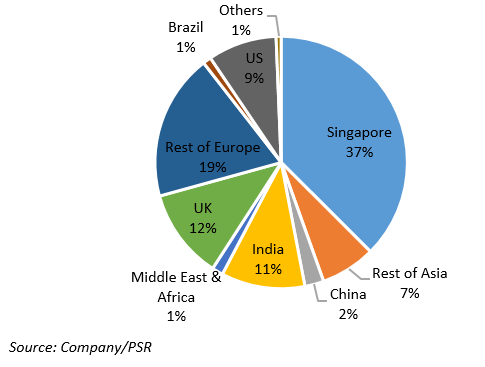
Figure 2: Revenue geographic breakdown in percentage
SEGMENT UPDATE
India: Underdeveloped electricity conditions are improving
According to World Energy Outlook 2016 from International Energy Agency, the population without electricity totalled 244mn with national electrification rate of 81% in India. The urban electrification rate is 4% shy of full access level while the rural rate is 74%. The imbalance of power distribution is severe across states and regions in India, as shown in Figure 3. In the Load Generation Balance Report 2016-17 published by Central Electricity Authority (CEA) in India, all regions in India suffered from power shortage in varying degrees for the year 2015-16. The northern states where have second largest amount of electricity demand are subject to respective c.5% energy and c.7% peak deficit. Though CEA expected such a situation will be improved, as shown in Figure 4, deficiency of electricity in relatively underdeveloped regions such as eastern and north-eastern states could worse off for the year 2016-17.
Figure 3: Actual power supply position for the year 2015-2016
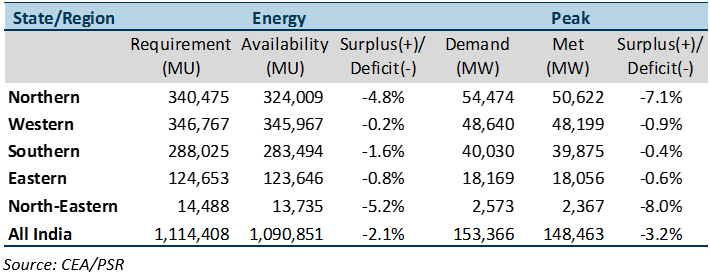
Figure 4: Anticipated all India power supply position for the year 2016-17
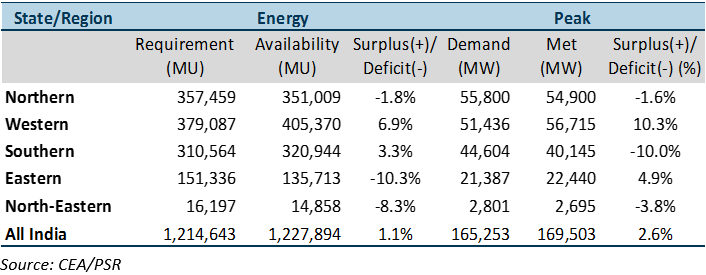
MU: million units, MW: megawatt, GW: Gigawatt, BU: billion units
The Indian government has been actively expanding the development of infrastructure for electrification. Referring to Figure 5, the installed capacity across the country has grown to 302.1 GW with a compound annual growth rate of 9.6% from 2007 to 2016. As of Apr-17, the installed capacity was recorded at 329.2 GW according to Ministry of Power in India. In the National Electricity Plan 2016, the total capacity addition during 2017 to 2022 is expected to be 187.8 GW, tantamount to 57% growth from the current amount. However, the CAGR of actual electricity generation was only 5.9% from 2007 to 2016, which translated to a relatively low plant load factor (PLF), a measure of average capacity utilisation. Though electricity generation was recorded at a new high of 1,107.4 BU in 2015-16, the PFL arrived at a new low of 42%. We can see a downtrend of PLF over the past 10 years.
Figure 5: Installed capacity, electricity generation, and plant load factor
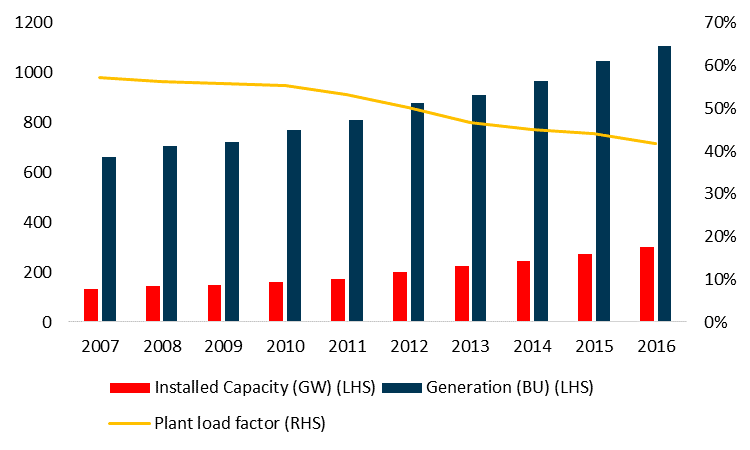
Source: National Electricity Plan 2016/CEA/PSR
There are several major factors resulting in lower PLF and power shortage.
The India governement has plans to improve the scale as well as efficiencies of the power industry. Besides “Power for All” scheme to electrify all households, industries, and commercial establishment by Mar-19, elimination of coal dependecy over the next couple of years is on track. We can see the ambition of Modi’s administration, and expect a promising long-term outlook in India’s power sector.
Singapore: Fierce competition in electricity sector until 2019/20
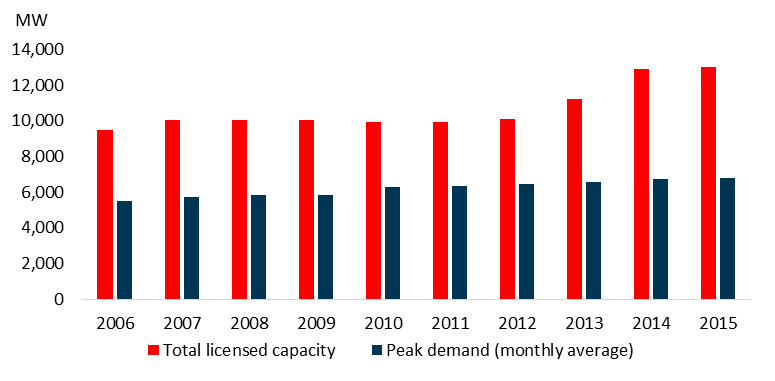
According to Energy Market Authority (EMA), electricity glut has been consistent over the past decade, shown in Figure 6. As of 2015, the power supply and demand was recorded at 47,843.8 GWh and 47,513.8 GWh respectively. The power surplus was reported at 330 GWh in 2015 though it has trending down from 2006 to 2015. During the period, the total licensed generation capacity and peak demand delivered respective CAGR of 3.6% and 2.9% moderately, shown in Figure 7.
Figure 6: Narrow electricity supply glut
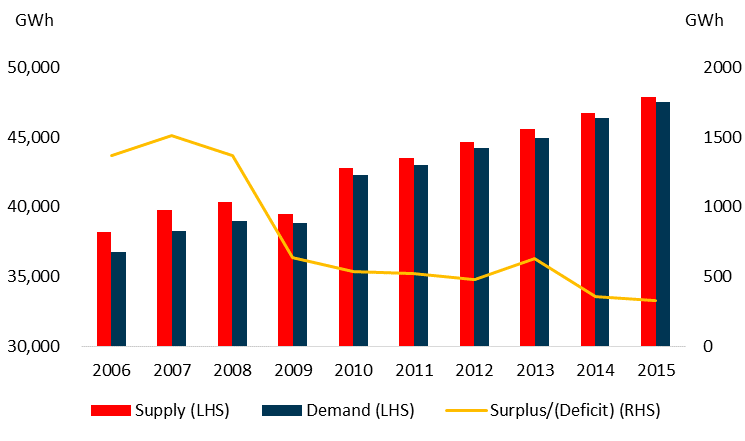
Source: EMA/PSR
Figure 7: Total licensed capacity and peak demand
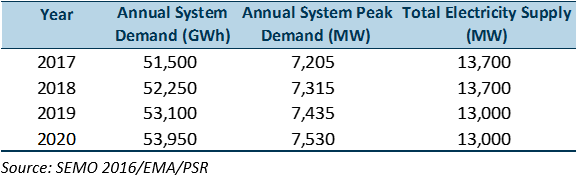
Looking ahead, EMA projected power demand will grow modestly to 53,950 GWh with CAGR of 1.5% from 2017 to 2020, according to Singapore Electricity Market Outlook 2016. In 4 years, the projected installed capacity will reach 13,700 MW, and 700 MW of it will be retired thereafter, shown in Figure 8. The current oversupply condition could subside by 2019.
Figure 8: Projected demand and supply
In Singapore, electricity generated through CCGT/Co-Gen/Tri-Gen plants took up 97% of total units as of 2016, and CCGT is the major operating plant in the category. At the moment, the contracted LNG is flooding the power sector. The “take-or-pay” structure leads power companies to take in the excess gas to generate electricity. The long-term pipeline natural gas (PNG) contracts are expected to expire after 2020. Thus, the glut of feedstock may only decline gradually with the exit of PNG so that excess LNG can fill in the gap. By then, the power supply and demand is forecasted to be more balanced.
Please sign in to download the full report in PDF.

Guangzhi graduated from Singapore Management University with a Master degree in Applied Finance and from South China University of Technology with a Bachelor degree in Electronic Commerce.
The current sector coverages include Energy, Utilities, and Mining sectors. He has 3 years experience in equity research in both Hong Kong and Singapore market. He is the mandarin spokesperson for Phillip Securities Research in relation to China-related projects and all mandarin seminars and client events.
