The Positives
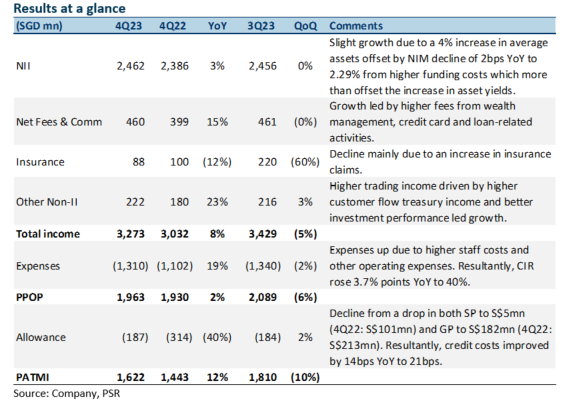
+ Net interest income grew 3% YoY. NII growth was led by a 4% increase in average assets, which was offset by NIM moderating by 2bps YoY to 2.29% and stable loan growth. NIM moderation was mainly from higher funding costs, which offset the increase in asset yields. OCBC has provided FY24e guidance for NIM to be in the range of 2.20% to 2.25%, with FY23 exit NIM currently at 2.26%.
+ Fee income continues to grow. Fee income rose 15% YoY to S$460mn. This was due to the broad-based growth in wealth management fees from increased customer activities, higher credit card fees, and loan and trade-related fees. Furthermore, the Group’s FY23 wealth management income grew 26% YoY to S$4.3bn and contributed 32% to the Group’s total income FY23 (FY22: 30%). OCBC’s wealth management AUM was 2% higher YoY at S$263bn driven by continued net new money inflows.
+ Allowances are down 40% YoY, and credit costs are at 21bps. Total allowances fell 40% YoY to S$187mn as SPs fell to S$5mn (4Q22: S$101mn) and GPs dipped to S$182mn (4Q22: S$213mn). Resultantly, total credit costs improved by 14bps YoY to 21bps. Total NPAs were down 16% YoY to S$2.9bn as new NPA formation fell 78% YoY to S$54mn, and the NPL ratio improved by 20bps YoY to 1.0%. Full-year FY23 credit costs were higher at 20bps (FY22: 16bps) from both impaired and non-impaired assets. OCBC has guided for FY24e credit costs to be stable and come in between 20 to 25bps.
The Negatives
– Insurance income down 12% YoY. Insurance income fell 12% YoY to S$88mn, driven by higher claims in Singapore and Malaysia, partially offset by higher contributions from the Singapore life business arising from better investment performance. FY23 total weighted new sales fell 12% YoY to S$1.66bn, as sales in Singapore declined, while new business embedded value (NBEV) declined 11% YoY to S$762mn. Margins saw a slight increase due to a more favorable product mix. Nonetheless, FY23 profit contribution from insurance rose 30% YoY to S$636mn, led by improved investment income.
– Expenses creep up. Operating expenses rose 19% YoY to S$1.31bn, mainly from higher staff costs and other operating expenses. The rise in staff costs was led by annual salary adjustments, headcount growth, and one-off support to help junior employees cope with rising cost-of-living concerns. Resultantly, the 4Q23 cost-to-income ratio (CIR) rose 3.7% points YoY to 40%. Nonetheless, full-year FY23 CIR improved by 4.2% points YoY to 38.7% as the rise in income outpaced the rise in expenses.
– CASA ratio continues to dip. The Current Account Savings Accounts (CASA) ratio fell 3.1% points YoY to 48.7% due to the high-interest rate environment and a continued move towards fixed deposits (FD). Nonetheless, total customer deposits grew 4% YoY to S$364bn, underpinned by strong growth in FDs. The Group’s funding composition remained stable with customer deposits comprising 81% of total funding.

Glenn covers the Banking and Finance sector. He has had 3 years of experience as a Credit Analyst in a Bank, where he prepared credit proposals by conducting consistent critical analysis on the business, market, country and financial information. Glenn graduated with a Bachelor of Business Management from the University of Queensland with a double major in International Business and Human Resources.
