The Positives
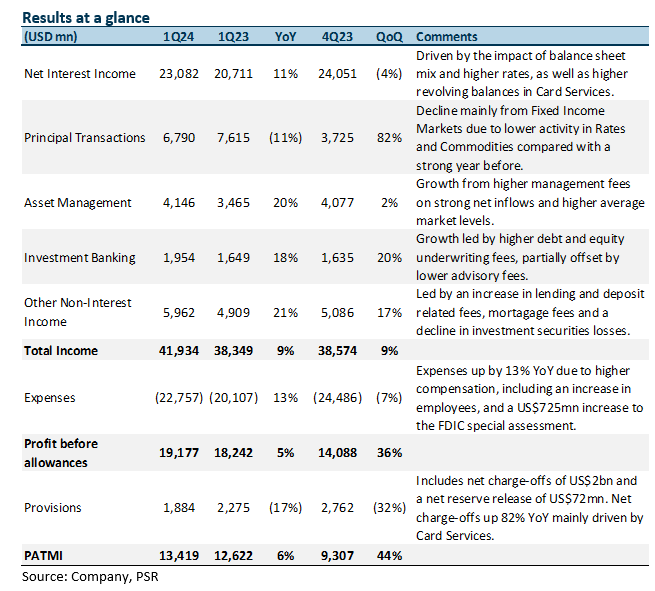
+ Net interest income rises YoY. NII rose 11% YoY to S$23.1bn due to the impact of the balance sheet mix, higher rates, and higher revolving balances in the Card Services, largely offset by deposit margin compression and lower deposit balances in the Consumer and Community Banking (CCB) segment. Net yield on interest-earning assets grew by 8bps YoY to 2.71% but saw a dip of 10bps QoQ as the cost of funds grew to outpace the asset yields. Excluding First Republic, loans grew by 3% YoY while deposits remained flat. Loan growth came mainly from CCB (+6% YoY), while both Commercial Banking (CIB) and Asset & Wealth Management (AWM) loans grew by 1% YoY.
+ Higher fees benefit Asset Management. Asset management income rose 20% YoY to US$4.1bn, largely driven by higher management fees on strong net inflows and higher average market levels, partially offset by lower net interest income due to deposit margin compression. Assets under management (AUM) grew 19% YoY to US$3.6tn, and client assets grew 20% YoY to US$5.2tn, mainly from higher market levels and continued net inflows. Notably, AUM had long-term net inflows of US$34bn in 1Q24 (4Q23: US$12bn).
+ Investment banking growth lifted banking revenue. Banking revenue rose 6% YoY to US$4.5bn, mainly from investment banking fees, which grew 18% YoY from higher debt and equity underwriting fees, partially offset by lower advisory fees. This was offset slightly by lower payments revenue (-1% YoY) from deposit margin compression and higher deposit-related client credits, largely offset by fee growth and higher deposit balances.
+ Provisions fall 17% YoY. Provisions for credit losses fell 17% to US$1.8bn, which includes net charge-offs of US$2bn and a net reserve release of US$72mn (1Q23: net charge-offs of US$1.1bn and net reserve build of US$1.1bn). Net charge-offs rose 79% YoY due to continued normalization in Card Services. The total net charge-off rate rose 37bps YoY to 1.33% from an increase in Card Services net charge-off rate to 3.32% (1Q23: 2.07%).
The Negatives
– Market revenue down 5% YoY. Markets revenue, consisting of fixed-income markets and equity markets, was down 5% YoY to US$8bn. Fixed income markets were down 7% YoY to US$5.3bn, driven by lower activity in Rates and Commodities compared to a strong 1Q23 quarter, partially offset by strong results in Securitised Products. Equity markets remained flat YoY at US$2.7bn. Nonetheless, total markets & securities revenue only dipped 3% YoY to US$9.2bn as the decline in markets revenue was partially offset by securities services revenue rising 3% YoY to US$1.2bn.
– Expenses up 13% YoY. Noninterest expense rose 13% YoY to US$22.8bn, driven by higher compensation, including an increase in employees, and a US$725mn increase to the FDIC special assessment to reflect the FDIC’s revised estimated losses. Notably, CCB’s non-interest expense was up 15% YoY from higher compensation, primarily for bankers and advisors, as well as technology, in addition to continued investments in marketing. CIB’s noninterest expense was down 4% YoY, predominantly driven by lower legal expenses.

Glenn covers the Banking and Finance sector. He has had 3 years of experience as a Credit Analyst in a Bank, where he prepared credit proposals by conducting consistent critical analysis on the business, market, country and financial information. Glenn graduated with a Bachelor of Business Management from the University of Queensland with a double major in International Business and Human Resources.
