Exxon Mobil Corporation (NYSE: XOM)
(Current Price: US$110.61) – TECHNICAL SELL
Sell price: US$110.61 Stop loss: US$116.50 Take profit: US$96.70
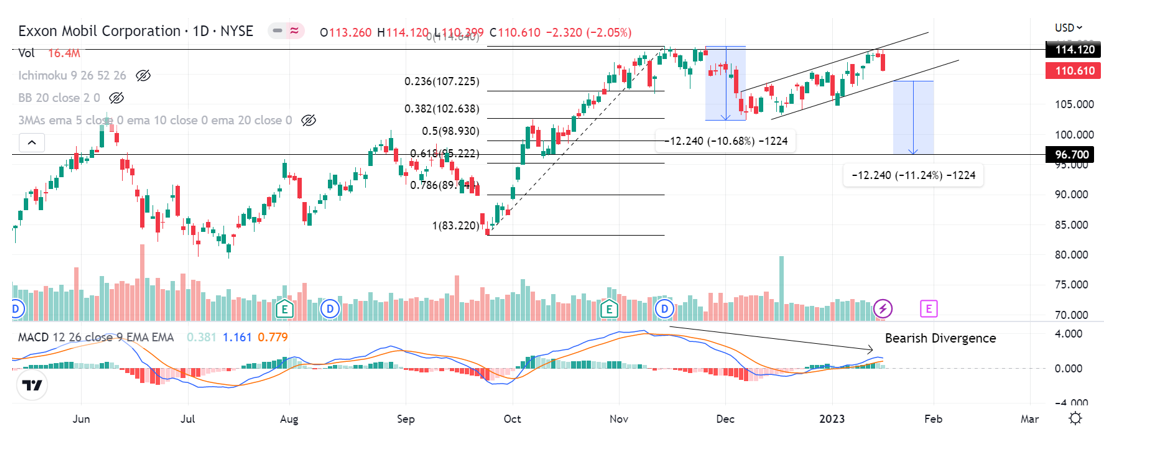
The price has traded in a possible bearish flag formation after it found resistance at the double top level of US$114 with the formation of a bearish engulfing candlestick on 18 January.
The Moving Average Convergence Divergence (MACD) technical indicator is showing signs of weak momentum as it made a lower high while the price attempted the previous swing high resistance at US$114, which is a bearish divergence signal.
With that, the price could reach the US$96.70 level, by taking the height of the pullback from US$114 projected onto the base of the bearish flag channel. This target is confluent with a prior swing low formed in October 2022, and a 50% Fibonacci retracement level near US$99, using the swing high of US$114.64 and swing low of US$83.22.
Expected timeline of the trade is 2-4 weeks from the date of report issuance.

I analyze the stock market and conduct technical analysis to provide investment recommendations. I look forward to having a conversation with you in our in-house seminars and presentations to identify good risk-reward trading strategies together. I graduated from Nanyang Technological University with a Bachelor of Accountancy (Honours).
