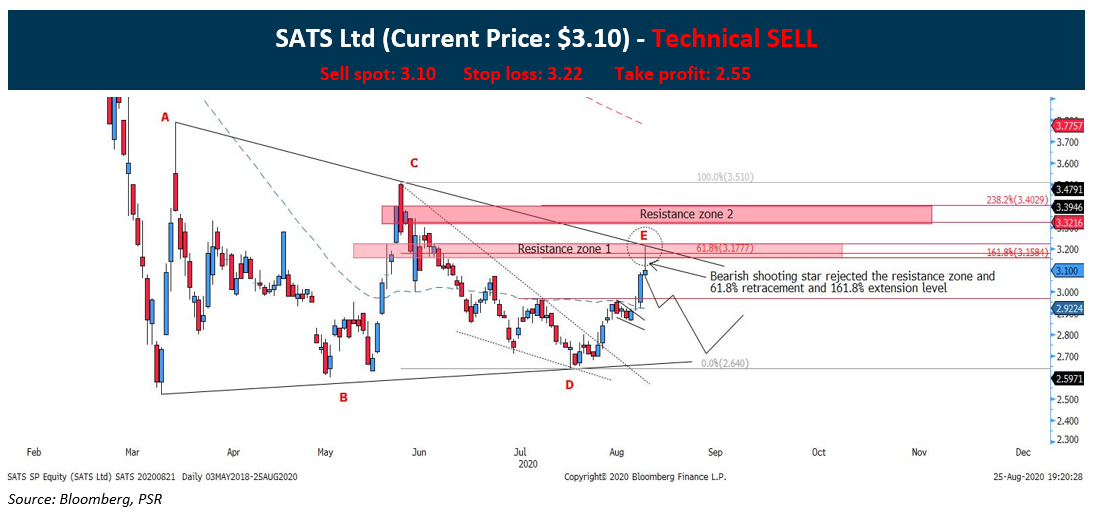
SATS Ltd (SGX: S58) unexpected strong upside has been fulfilled based on our previous report dated 21st August. However, as we have mention in that report that the strong resistance zone is a targeted sell-zone and based on the technical, we have arrived sooner than expected:
*Timeline of the trade is 2 weeks from the date issued.
*There remain a possibility that the stock may rebound from the resistance turned support level at $3.00-$2.94. Should that happen, we will see a rally to test the higher resistance zone at $3.31-$3.40
CHART LEGENDS
Moving average
Red dotted line = 200 periods Moving average
Blue dotted line = 50 periods Moving average
