Microsoft Corp (US: MSFT) looks set to continue its uptrend momentum:
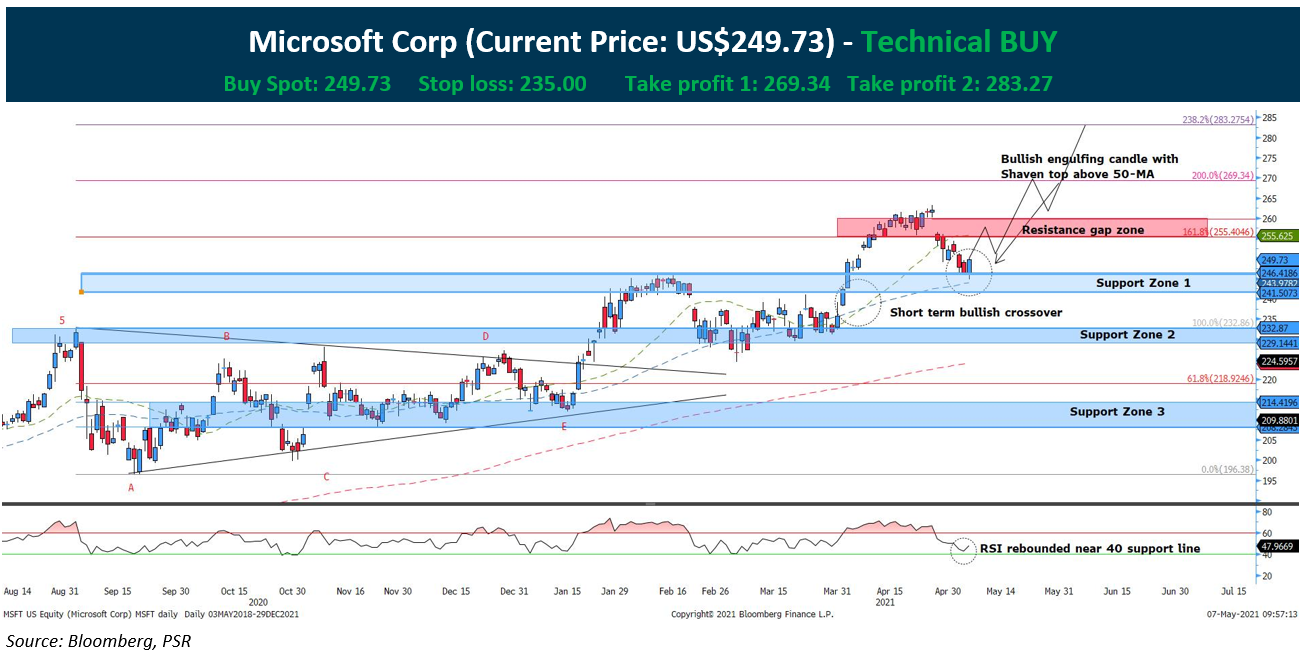
- Microsoft has been on a strong uptrend after prices broke above the 5-wave symmetrical triangle pattern in January 2021.
- The strong bullish momentum looks set to continue. The recent bullish engulfing candle, above Support Zone 1 and the 50-day Moving Average, signals a bullish rebound.
- The bullish rebound signal is further strengthened by the Relative Strength Index rebounding off the 40 support line (in green).
*Expected timeline of the trade is 10 weeks from the date of report issuance.
*A potential correction off resistance gap zone at US$260 could see prices fall to Support Zone 2 before rebounding.
CHART LEGEND
Moving Average
Red dotted line: 200 Period MA
Blue dotted line: 50 Period MA
Green line B: 22 Period MA