Technical Pulse: Medtecs International Corp Ltd September 23, 2020 1363

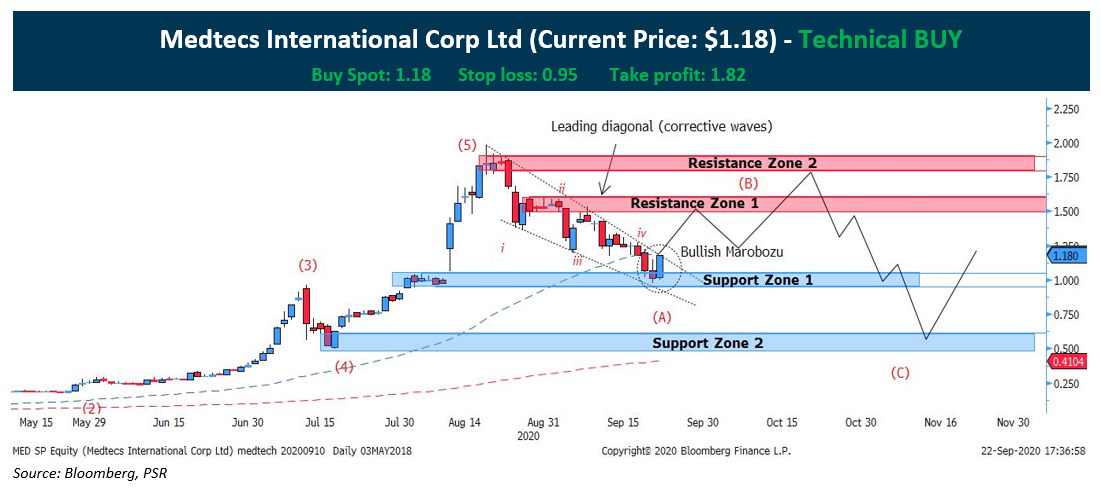
Medtecs International (SGX: 546) corrective sell down has met our expected flow based on our report dated on 9th September 2020. Moving forward, the technical indicate that there is another short term upside to complete the 2nd sub wave of the whole corrective wave:

  1. The 5-sub-wave leading diagonal of the corrective waves has been completed with wave A completed after prices rebound on the support of $0.95-$1.05.
  2. Bullish Marobozu candle on the support zone 1 confirms the upside after Monday’s inverted hammer, which is indicative of a bullish reversal formation.
  3. Once prices breaks the upper bound of the leading diagonal/wedge, we will then see the stock confirming the bullish trend.


*Timeline of the trade is 3 weeks from the date issued.

*The corrective phase has not ended and the last leg C wave will likely rebound from support zone 2


CHART LEGENDS

Moving average

Red dotted line = 200 periods Moving average

Blue dotted line = 50 periods Moving average

Subscribe
Notify of
guest
0 Comments
Inline Feedbacks
View all comments

Get access to all the latest market news, reports, technical analysis
by signing up for a free account today!