Technical Pulse: Intel Corp March 2, 2021 482


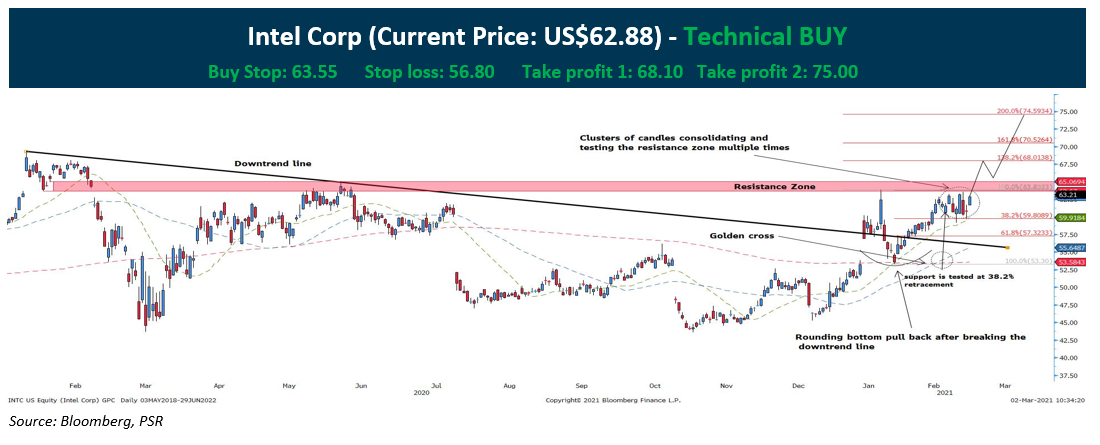
Intel Corp (US: INTC) has been ranging since Feb 2020 with the internal trend tilting towards the downside. January 2021 saw Intel in a fresh new lighting after it broke the downtrend line, ending the prolong downtrend line. Despite the stock has yet to make new high, recent technical indicate that the stock will be soon embarking on the upside:


  1. The rounding bottom pullback is well supported at US$53.30 and the 200-day moving average after the pullback.
  2. The clusters of candles are testing the resistance zone multiple times, therefore weakening the zone in the process. Also, they are well supported at 38.2% retracement level, indicating a shortfall. Enlarging our views, we can interpret the rounding bottom and the clusters of candles as the handles. Hence, should prices break above the resistance zone, we can confirm the cup and handle bullish up move.
  3. Prices are trending above all three major moving averages after the golden cross is confirmed.


*Timeline of the trade is 3 weeks from the date issued.

*Should the resistance zone fail to break, the likelihood of a deep retracement to US$52.50 before a rebound is likely too.


CHART LEGENDS


Moving average

Red dotted line = 200 Periods Moving average

Blue dotted line = 50 Periods Moving average

Green dotted line = 22 Periods Moving average

Subscribe
Notify of
guest
1 Comment
newest
oldest most voted
Inline Feedbacks
View all comments

Get access to all the latest market news, reports, technical analysis
by signing up for a free account today!