
Technicals for Agriculture
Since hitting a high of 196 in July 2012, the Bloomberg Agriculture Subindex Total Return has been on a steep downtrend. Even today, the downtrend still seems intact. However, we might be in the early stages of a monumental trend reversal as the agriculture index hit a low of 95.19 since December 2017. In total, the Bloomberg Agriculture Subindex fell 51% throughout the past five years. The Bloomberg Agriculture Subindex is composed of mainly Futures contracts of corn (21%), soybeans (20%), wheat (11%), soybean meal (11%), sugar (9.5%), soybean oil (8.2%), coffee (7.8%) and cotton (4.9%).
Note that agriculture commodity cycles move with a clear defined timeline. A full cycle consists of a secular bull and bear market. For this study, we will use the cyclical bottom to mark the start of the cycle and the following cyclical bottom to mark the end of the full cycle demarcated by the vertical lines in figure 1.
Extended periods of uptrend will bring about a bear a market while extended periods of downtrend will bring about a bull market as the demand and supply clears. With higher prices, more supply will come into the market thus causing the secular bear market to begin. On the other hand, the prolonged bear market will suppress price low enough to curb supply where demand outstrips supply, thus igniting the secular bull market.
Our long-term study shows that the extreme price range on the Bloomberg Agriculture Subindex is at 192 for the expensive side and 95 – 87 on the inexpensive side. When the Bloomberg Agriculture Subindex is near the extreme range, a significant mean reversion will take place where a major trend reversal occurs. For example, when the Bloomberg Agriculture Subindex is near the 95 – 89 “cheap” range, a secular uptrend and raging bull market tend to take over, vice versa.
Moreover, on the cyclical perspective, the Bloomberg Agriculture Subindex tends to form a cyclical bottom after 7 to 9 years of being in a full cycle. For instance, the cyclical bottom in October 2001 took 9 years to form after falling -54% from the 191 peak in 1997. A similar cyclical bottom was formed in December 2008 as well where the Bloomberg Agriculture Subindex crashed 56% from the 216 peak in 2008. The market took 7 years to establish that cyclical bottom. Keep in mind both the cyclical bottom happened around the extreme inexpensive range after a major bear market of at least -50% drop.
Tradable instruments:
ETN:
iPath Bloomberg Agriculture Su – (AMEX:JJA)iPath Bloomberg Grains Total Return Sub-Index ETN is an exchange-trades note issued in the USA. The note will provide investors with a cash payment at the scheduled maturity or early redemption based on the performance of the underlying index, the Bloomberg Agriculture Total Return Index.
It tracks an index of grain futures contracts selected according to liquidity and diversity requirements.
The top holdings in JJG are Corn Futures (21%), Soybean Future (20%), Wheat Future (11%), Soybean Meal (11%), Sugar (9%), Soybean oil (8%), Coffee (7%), Cotton (4%) and KC HRW Wheat Future (4%).Last close price:
Bloomberg Agricultrure Subindex Total Return : 101.31
iPath Bloomeberg Grains Subindex Total Return ETN: 31.88
Figure 1: Bloomberg Agriculture Subindex Total Return monthly timeframe – Overdue for a secular uptrend
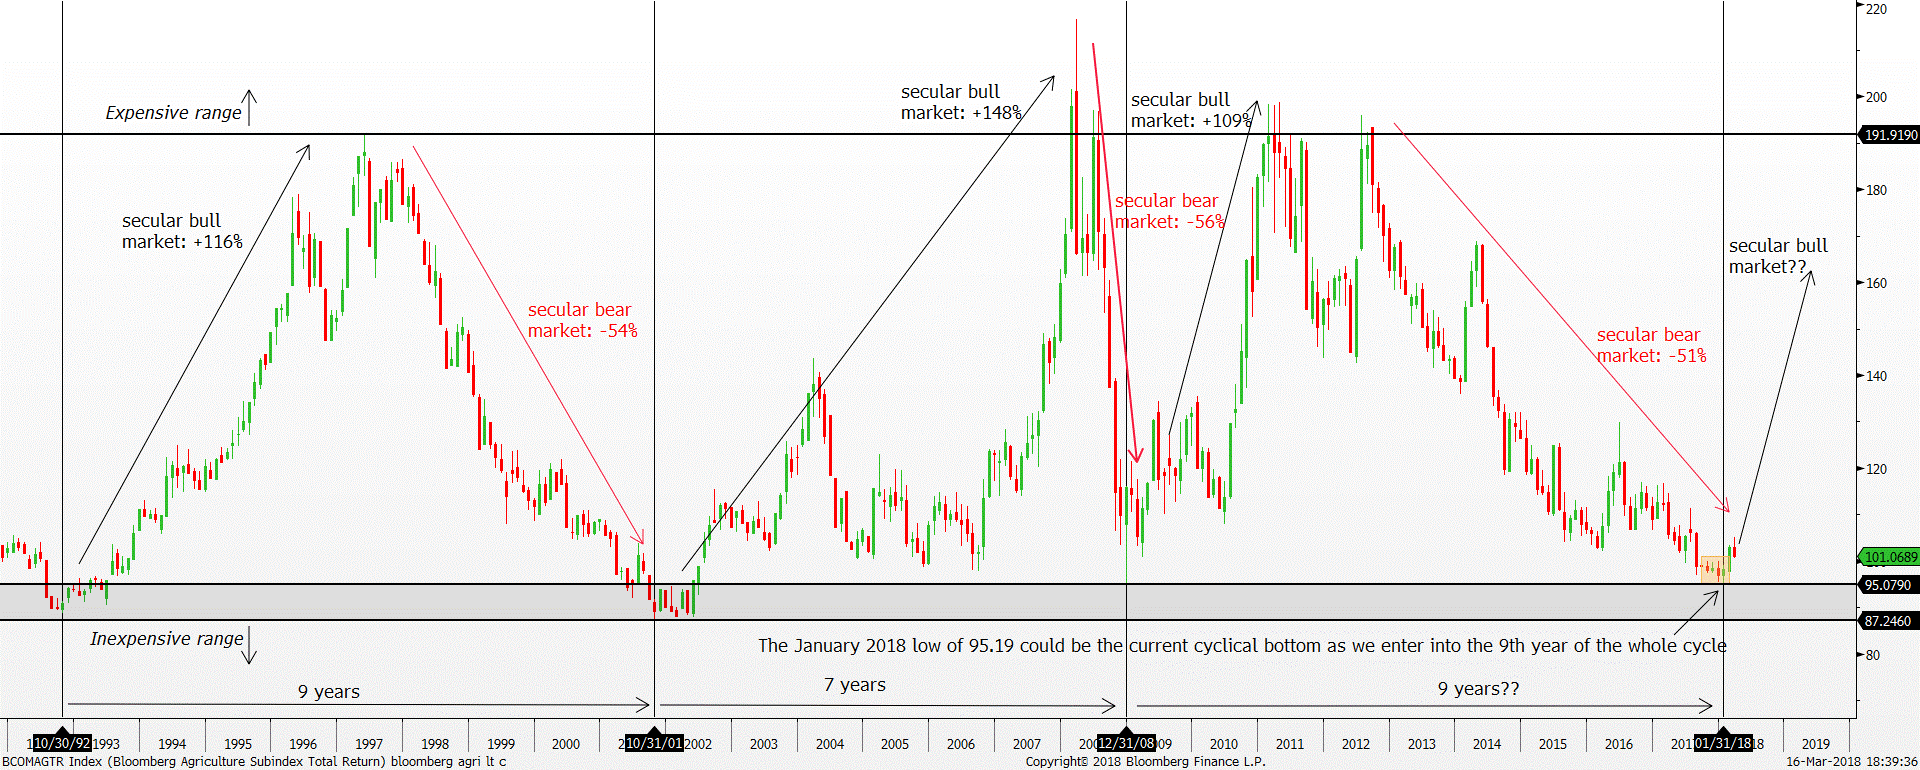
*vertical line demarctes the point where the cyclical bottom forms
Hence, using the December 2008 cyclical low as the base for calculating the start of the next cyclical bottom brings us to an interesting juncture currently. If we were to assume the January 2018 low of 95.19 as the cyclical low, it fits in nicely into the cycle where it took the market exactly 8 years to form this current cyclical bottom. In addition, the bear market since July 2012 has also taken the price down -51% from the 195.99 peak, similar to the price action in the prior two cycles.
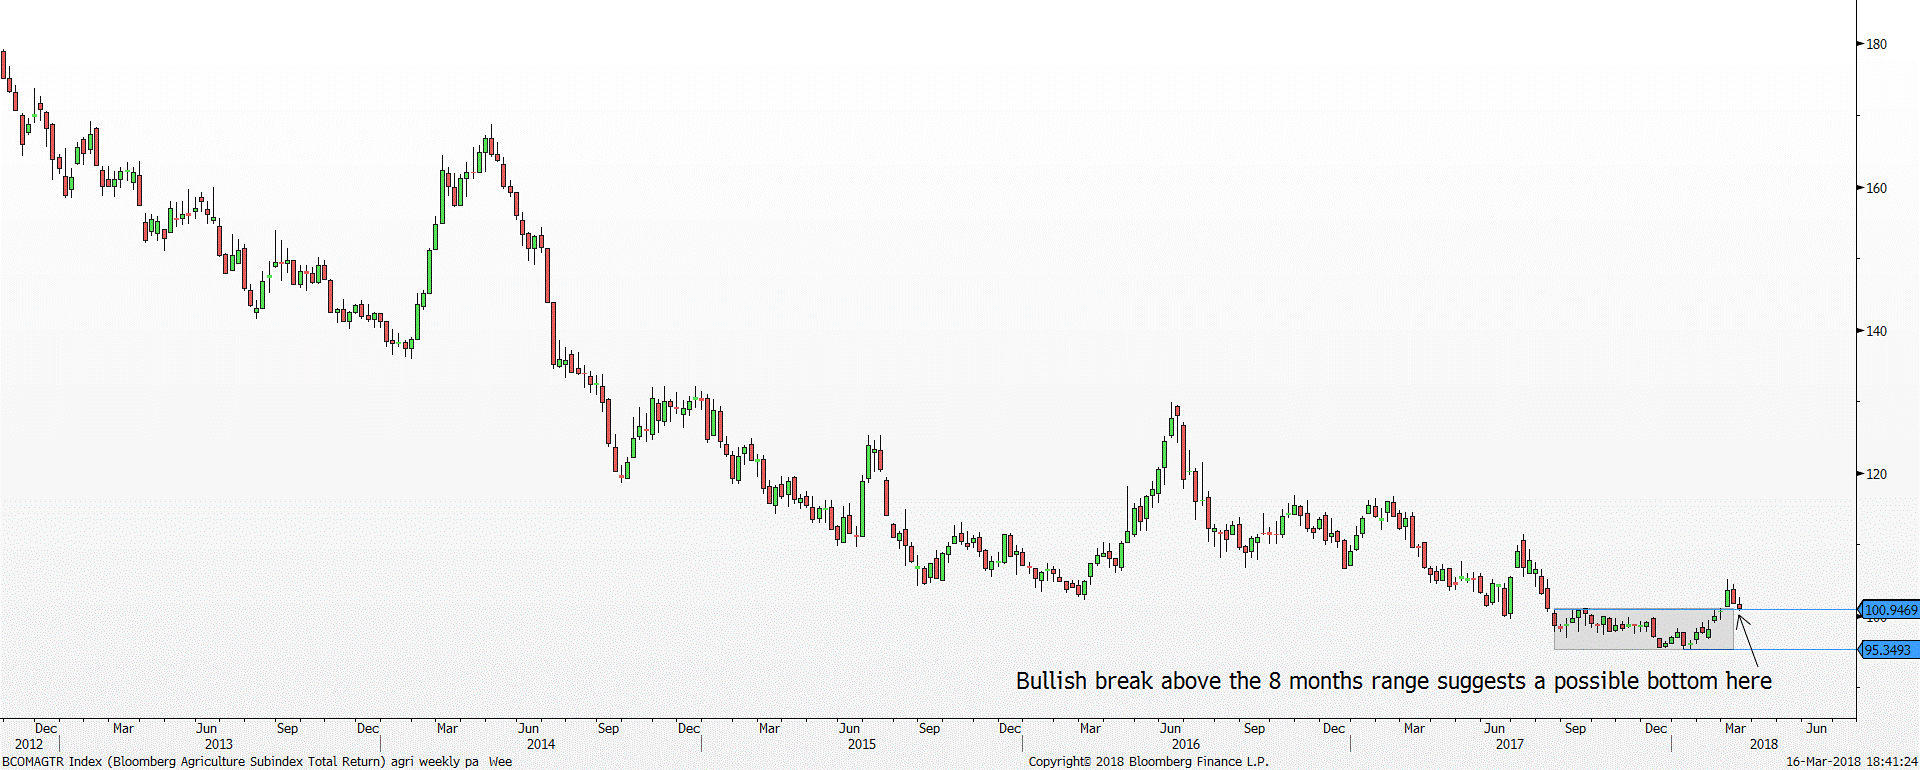
In addition, the February recovery of +5% has shown some sign of bottoming too from a price action perspective, as it broke above the eight months range high of 100.94.
Figure 2: Bloomberg Agriculture Subindex Total Return weekly timeframe – Bullish breakout above the 8 months range
Nonetheless, even if the January 2018 low does not turn out to be the cyclical bottom, we believe the Bloomberg Agriculture Subindex has limited downside. We believe the lowest it can fall to is the record low of 87.24 in October 2001, representing -14% downside. That is where massive shortages will appear in the market as supply dries up. Moreover, from a cyclical perspective, a secular bull market is overdue as we are currently in the 9th year of the cycle. Therefore, the bias or sentiment ahead is pointing toward the upside where a raging bull market should take control.
Notice how each secular bull market lifts the Bloomberg Agriculture Subindex by more than +100% into the 192 extreme expensive range first before the secular bear market regains control. Hence, for this next secular uptrend, we do expect a similar replay where the Bloomberg Agriculture Subindex should rally explosively for the following 3 – 5 years to retest the 192 extreme expensive range, representing more than +100% upside from the cyclical bottom.
Fundamentals for Agriculture
On the fundamental side of things, several long-term factors might contribute to the appreciation of prices of the crops that make up the Bloomberg Agriculture Subindex. There are three main uses for agriculture commodities, food, feed and fuel. Increases in global population has led to increasing demands for food as well as feed for livestock. The UN estimates that by 2030, the world will add another billion people and that by 2050, we will have an estimated 9 billion world population.
As emerging markets grow, the increased affluence in those historically poorer countries also has led to increased demand for meat and dairy products. Between 2000 to 2009, China’s GDP averaged about 12% p.a., in that time, their urban population grew from about 450mn to over 600mn (36% to 45% of total population) and their per capita consumption of pork grew from 31.2kg to 36.4kg (up 16.7%). Agriculture commodities are required as feed for this livestock, however, the conversion of calories is not equivalent.
More grain is required per kcal of energy provided by meat from livestock as compared to the kcal provided by eating the grain directly. As such, as demand for higher value food increases, there will be an even greater increase in demand for grain as feed.
Additionally, biofuel policies by governments across the globe has also led to increased demand for agricultural produce as fuel. Prior to 2003, drivers of demand for agricultural commodities were mostly attributable to demand for food and feed. However, since 2003, agriculture has become a substitute for energy source in the form of biofuel. Biofuels generally come in two forms, ethanol and biodiesel, which is produced by corn, wheat and sugar for the former and canola oil and soybean oil for the latter. As governments around the world try to combat the use of fossil fuels and search for more renewable forms of energy, demand for biofuels are likely to increase as well. The UN estimates that by 2025, 10.4% of global coarse grains and 12% of vegetable oil production will be consumed by biofuel production. Global biodiesel production is expected to reach 41.4bn litres by 2025, a 33% increase from 2015 levels.
Despite the expected increase in demand for agricultural commodities, global supply for these products may be faced with several headwinds that may impede the ability of farmers to match that demand.
Reduction in Arable land: In 2017, the UN reported that about a third of Earth’s arable land has become severely degraded and that fertile soil is being lost at the rate of 24bn tonnes a year. The factors contributing to the degradation of arable land consist of over farming, as well as climate change and increasing urbanisation.
Global crop yield is stagnating: Crop yield per hectare of land has stagnated since 2007. Crop yield is dependent on several factors: weather, water and use of genetically modified crops (GMO). Climate change has had an unpredictable impact on crop yields, however, of late this effect has often been negative. Additionally, water scarcity has become a major issue for agricultural production. The UN estimates that by 2050, agricultural water usage will need to double in order supply the food needs of the world’s population.
In the shorter term, there are several factors that might cause a turnaround in prices of agricultural produce.
Harsh winter conditions: The harsh winter conditions have already started to affect the USA winter wheat production. The earlier and intense cold snap has led to deteriorating conditions for US wheat farmers, driving prices of US wheat higher; Kansas City wheat prices closed 8.7% up at the end of February, and Chicago wheat prices gained 7.2%.
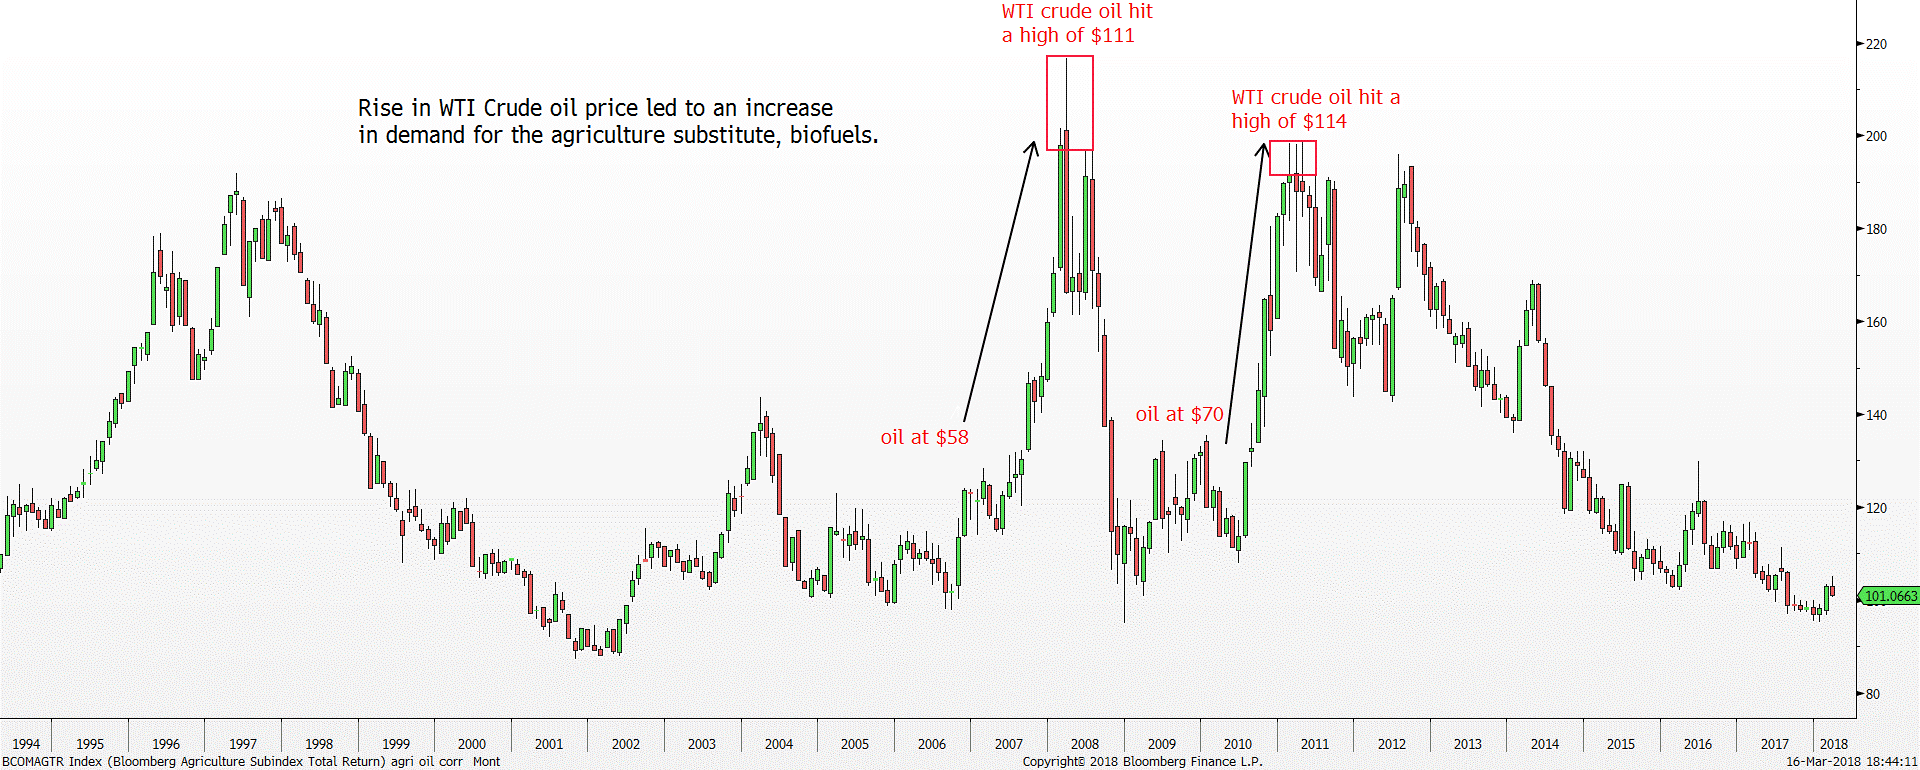
Stabilizing and increasing Oil prices: In 2008, demand for oil pushed crude oil prices to new highs of USD140 per barrel. This caused biofuels to become more competitive sources of fuel. Though oil prices are currently much lower compared to 2008, the recent stabilisation and recovery in oil prices may once again lead to increase demand for biofuels as a substitute fuel source.
Figure 3: Bloomberg Agriculture SubIndex Total Return monthly timeframe– rise in WTI oil price led to increase demand in biofuels
In summary, from a cyclical point of view, we believe the Bloomberg Agriculture Subindex Total Return is ripe for a major turnaround soon where a raging bull market should take over as we are in the 9th year of the cycle with price hovering near the 95 – 87 inexpensive range. Furthermore, the supply and demand fundamentals are also supportive of the secular bull market in the Bloomberg Agriculture Subindex Total Return from the increase in demand for food, feed and bio-fuel as well as the reduction in arable land which will lead to a drop in supply in the long-run.
Important Information
This report is prepared and/or distributed by Phillip Securities Research Pte Ltd ("Phillip Securities Research"), which is a holder of a financial adviser’s licence under the Financial Advisers Act, Chapter 110 in Singapore.
By receiving or reading this report, you agree to be bound by the terms and limitations set out below. Any failure to comply with these terms and limitations may constitute a violation of law. This report has been provided to you for personal use only and shall not be reproduced, distributed or published by you in whole or in part, for any purpose. If you have received this report by mistake, please delete or destroy it, and notify the sender immediately.
The information and any analysis, forecasts, projections, expectations and opinions (collectively, the “Research”) contained in this report has been obtained from public sources which Phillip Securities Research believes to be reliable. However, Phillip Securities Research does not make any representation or warranty, express or implied that such information or Research is accurate, complete or appropriate or should be relied upon as such. Any such information or Research contained in this report is subject to change, and Phillip Securities Research shall not have any responsibility to maintain or update the information or Research made available or to supply any corrections, updates or releases in connection therewith.
Any opinions, forecasts, assumptions, estimates, valuations and prices contained in this report are as of the date indicated and are subject to change at any time without prior notice. Past performance of any product referred to in this report is not indicative of future results.
This report does not constitute, and should not be used as a substitute for, tax, legal or investment advice. This report should not be relied upon exclusively or as authoritative, without further being subject to the recipient’s own independent verification and exercise of judgment. The fact that this report has been made available constitutes neither a recommendation to enter into a particular transaction, nor a representation that any product described in this report is suitable or appropriate for the recipient. Recipients should be aware that many of the products, which may be described in this report involve significant risks and may not be suitable for all investors, and that any decision to enter into transactions involving such products should not be made, unless all such risks are understood and an independent determination has been made that such transactions would be appropriate. Any discussion of the risks contained herein with respect to any product should not be considered to be a disclosure of all risks or a complete discussion of such risks.
Nothing in this report shall be construed to be an offer or solicitation for the purchase or sale of any product. Any decision to purchase any product mentioned in this report should take into account existing public information, including any registered prospectus in respect of such product.
Phillip Securities Research, or persons associated with or connected to Phillip Securities Research, including but not limited to its officers, directors, employees or persons involved in the issuance of this report, may provide an array of financial services to a large number of corporations in Singapore and worldwide, including but not limited to commercial / investment banking activities (including sponsorship, financial advisory or underwriting activities), brokerage or securities trading activities. Phillip Securities Research, or persons associated with or connected to Phillip Securities Research, including but not limited to its officers, directors, employees or persons involved in the issuance of this report, may have participated in or invested in transactions with the issuer(s) of the securities mentioned in this report, and may have performed services for or solicited business from such issuers. Additionally, Phillip Securities Research, or persons associated with or connected to Phillip Securities Research, including but not limited to its officers, directors, employees or persons involved in the issuance of this report, may have provided advice or investment services to such companies and investments or related investments, as may be mentioned in this report.
Phillip Securities Research or persons associated with or connected to Phillip Securities Research, including but not limited to its officers, directors, employees or persons involved in the issuance of this report may, from time to time maintain a long or short position in securities referred to herein, or in related futures or options, purchase or sell, make a market in, or engage in any other transaction involving such securities, and earn brokerage or other compensation in respect of the foregoing. Investments will be denominated in various currencies including US dollars and Euro and thus will be subject to any fluctuation in exchange rates between US dollars and Euro or foreign currencies and the currency of your own jurisdiction. Such fluctuations may have an adverse effect on the value, price or income return of the investment.
To the extent permitted by law, Phillip Securities Research, or persons associated with or connected to Phillip Securities Research, including but not limited to its officers, directors, employees or persons involved in the issuance of this report, may at any time engage in any of the above activities as set out above or otherwise hold an interest, whether material or not, in respect of companies and investments or related investments, which may be mentioned in this report. Accordingly, information may be available to Phillip Securities Research, or persons associated with or connected to Phillip Securities Research, including but not limited to its officers, directors, employees or persons involved in the issuance of this report, which is not reflected in this report, and Phillip Securities Research, or persons associated with or connected to Phillip Securities Research, including but not limited to its officers, directors, employees or persons involved in the issuance of this report, may, to the extent permitted by law, have acted upon or used the information prior to or immediately following its publication. Phillip Securities Research, or persons associated with or connected to Phillip Securities Research, including but not limited its officers, directors, employees or persons involved in the issuance of this report, may have issued other material that is inconsistent with, or reach different conclusions from, the contents of this report.
The information, tools and material presented herein are not directed, intended for distribution to or use by, any person or entity in any jurisdiction or country where such distribution, publication, availability or use would be contrary to the applicable law or regulation or which would subject Phillip Securities Research to any registration or licensing or other requirement, or penalty for contravention of such requirements within such jurisdiction.
This report is intended for general circulation only and does not take into account the specific investment objectives, financial situation or particular needs of any particular person. The products mentioned in this report may not be suitable for all investors and a person receiving or reading this report should seek advice from a professional and financial adviser regarding the legal, business, financial, tax and other aspects including the suitability of such products, taking into account the specific investment objectives, financial situation or particular needs of that person, before making a commitment to invest in any of such products.
This report is not intended for distribution, publication to or use by any person in any jurisdiction outside of Singapore or any other jurisdiction as Phillip Securities Research may determine in its absolute discretion.
IMPORTANT DISCLOSURES FOR INCLUDED RESEARCH ANALYSES OR REPORTS OF FOREIGN RESEARCH HOUSE
Where the report contains research analyses or reports from a foreign research house, please note: