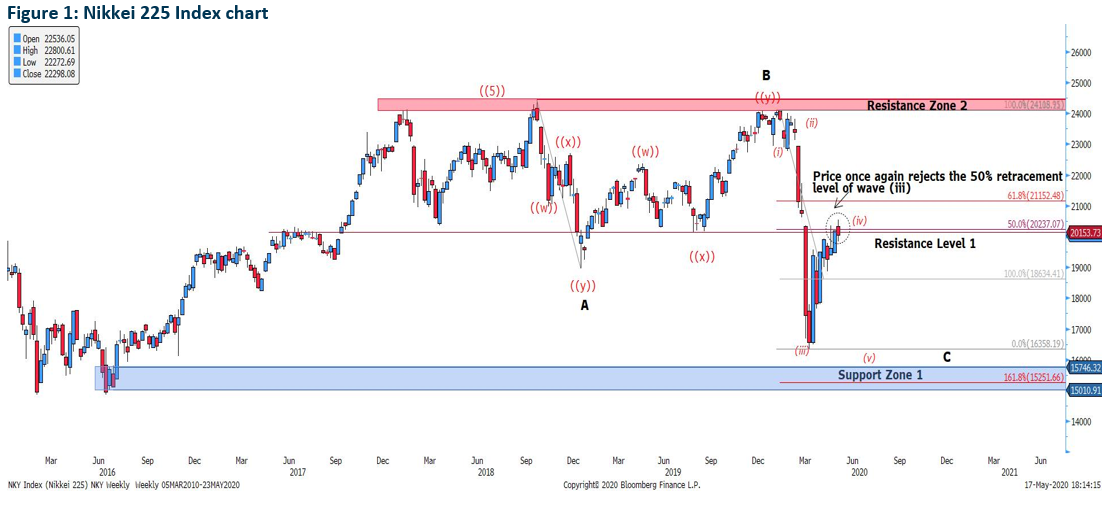
Nikkei 225 tried to break the 50.0% retracement level but was met with failure after last week’s bearish closure below the major resistance level at 2,037.07. As such, we believe that the Nikkei 225 has completed its sub-wave 4 movement and Nikkei will further slide towards 15,010.93 – 15,746.32 support zone.
Should prices break above the resistance level, the next immediate target for a sell-off will be at 61.8% of wave (iii) at 21,152.48.
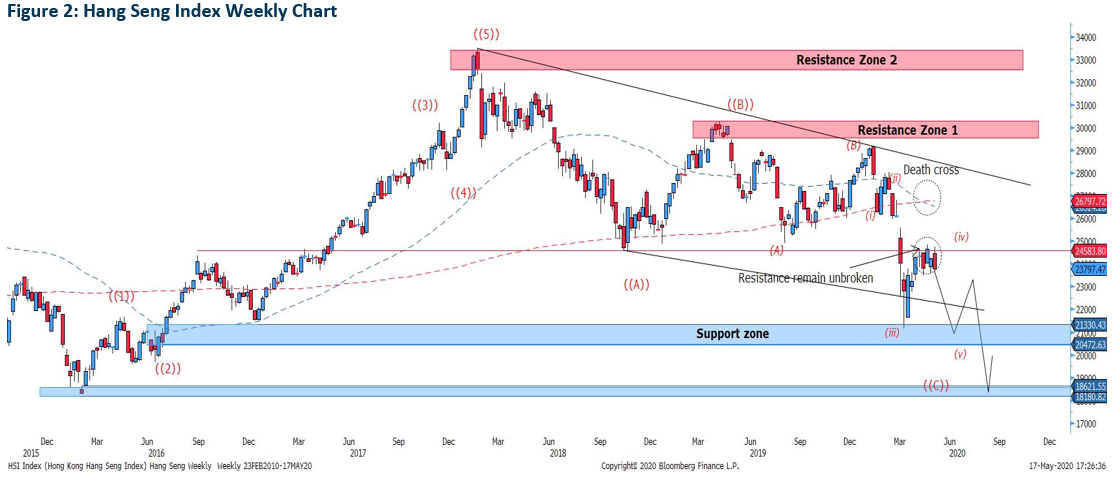
Hang Seng Index wave analysis remains unchanged as the supposed wave (iv) has not broken the resistance level of 24,583.80. The downtrend is still entrenched, with the ‘death-cross’ formation still valid as prices have been trending below the 200- and 50-Moving Average line. Furthermore, the descending channel has yet to be invalidated. Hence, we believe prices will enter a period of ranging before resuming its downside to the lower bound of the support zone at 20,472.63.
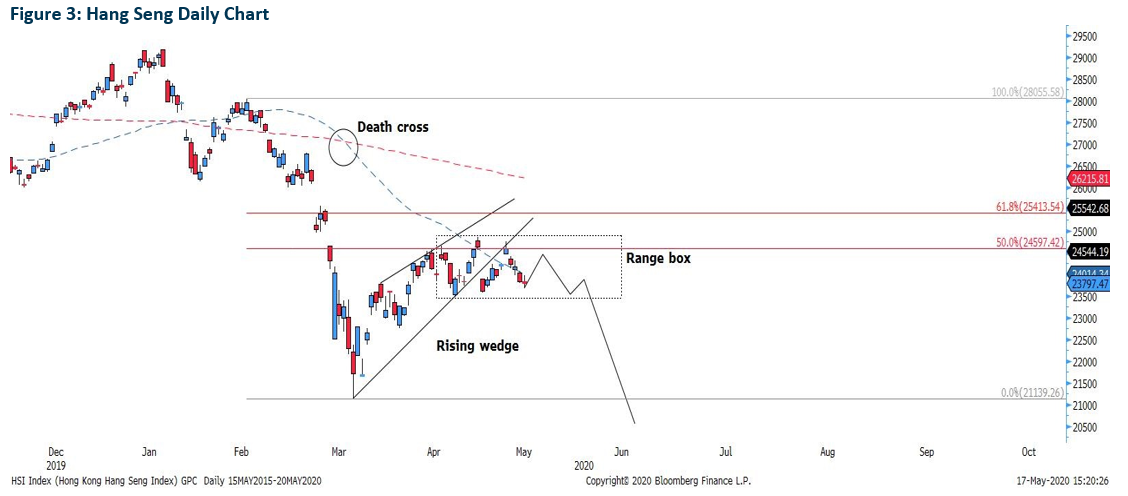
The daily chart for the Hang Seng Index shows a clearer picture of likely price movement and signs of a range-bound market is apparent. Firstly, the bearish candle closed as a Doji candle on Friday, signaling a loss in the selling momentum. Hence, the price will likely head for a short rally before a sell-down again. This movement will likely continue for a period and the sell-off will resume when prices break the 23,500 psychological support level.
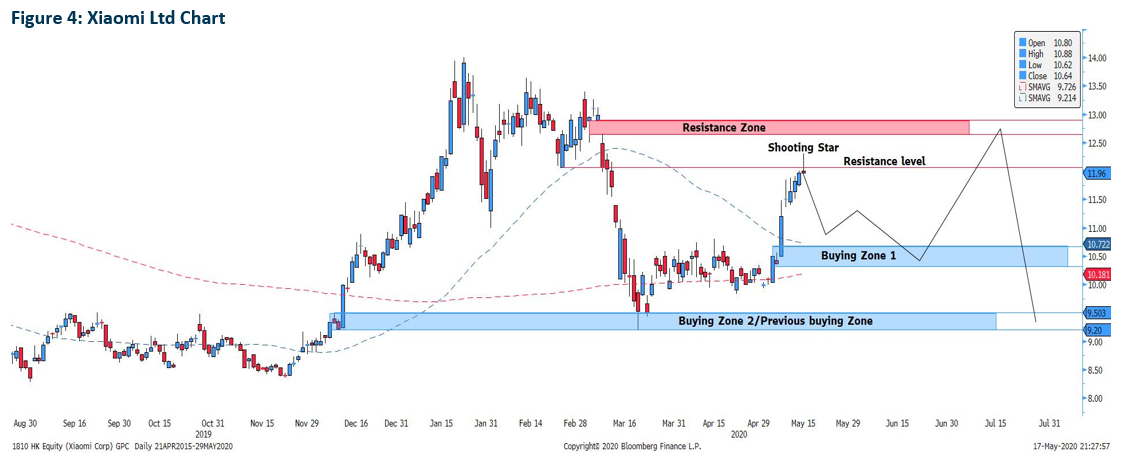
Xiaomi rebounded from the buying zone of $9.20 – $9.50 on the 19th of March shortly after our report on 17th March and the stock was ranging between $9.78 – $10.80 from 30th April 2020 to 6th May 2020 after the rebound. Strong bullish momentum was seen after prices rallied towards $12.30 on Friday’s peak but the stock rejected the resistance level at $12.04. Hence, we believe that the stock might entering a retracement when market opens on Monday, 18th May. Two demand levels at $10.68 – $10.34 and the previous buying level of $9.20 – $9.50 will be the key buying levels in the mid-term.
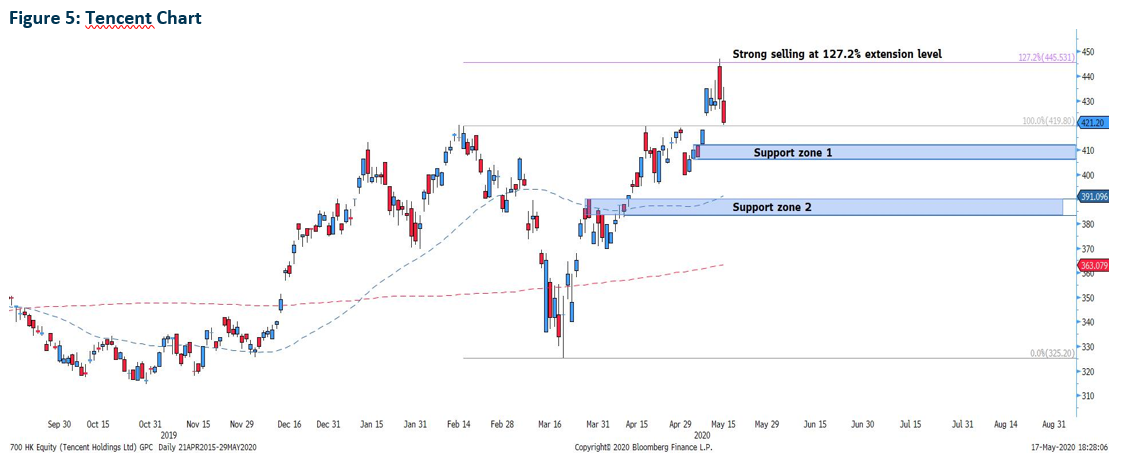
Tencent rallied after the long-legged Doji formation which we stated on our report in 20th March 2020. The rally was stronger than expected with price breaking the resistance level at $421.20 and Tencent begin to exhibit signs of reversal at 127.2% extension level of $325.20 – $419.80. As such, the potential rebound will be at the support zone 1 between $412.20 – $406.60. Should this support zone be invalidated, the next support zone between $382.00 – $389.40 will be the next target for the continued rally.
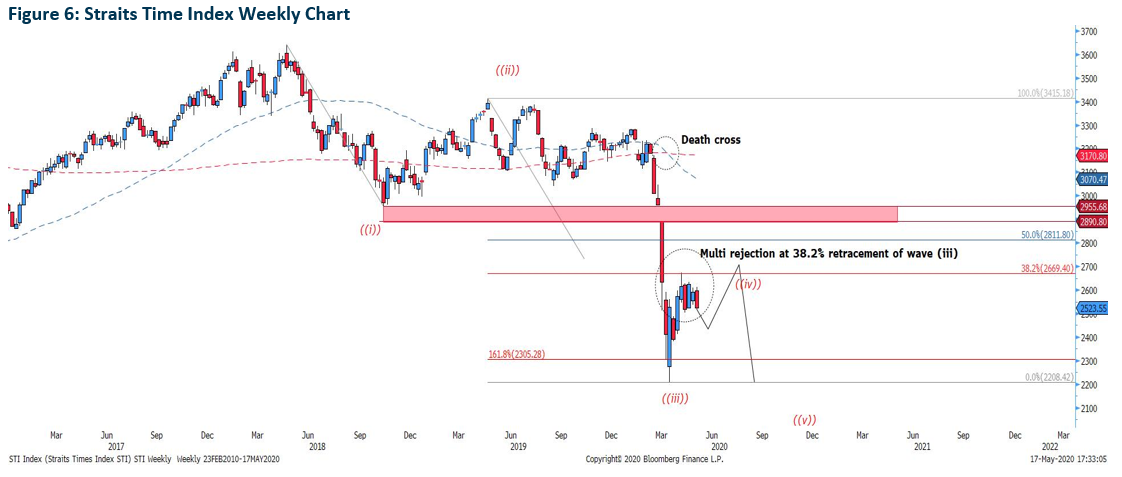
The weekly chart indicates that prices were unable to clear above the resistance level of 38.2% retracement level of wave (iii) at 2,669.40. Hence, the STI will likely fall to 2,500 before a rebound to retest the resistance level. Should the resistance level at the 38.2% retracement level be broken, we will see price test the 50% retracement level of wave (iii) at 2,811.80.
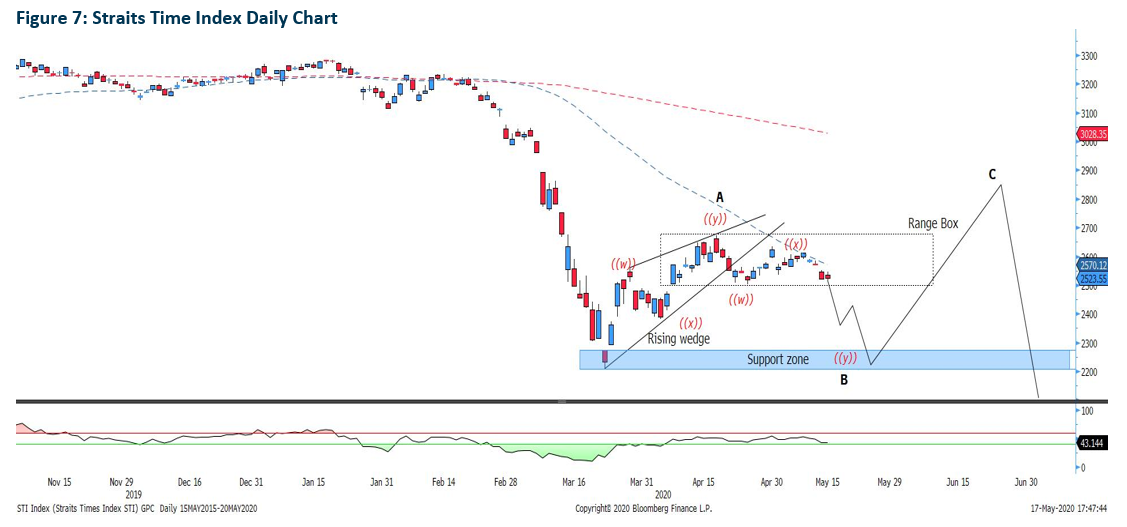
The daily chart shows a potential sub-bearish flat correction and the confirmation of whether STI will head for a flat corrective wave depends on whether the prices can break above the 2,500 support level. If so, prices will head towards the support zone between 2,200 – 2,267 before a 5 sub-wave up towards the 50% retracement level of wave (iii) as indicated in the weekly chart.
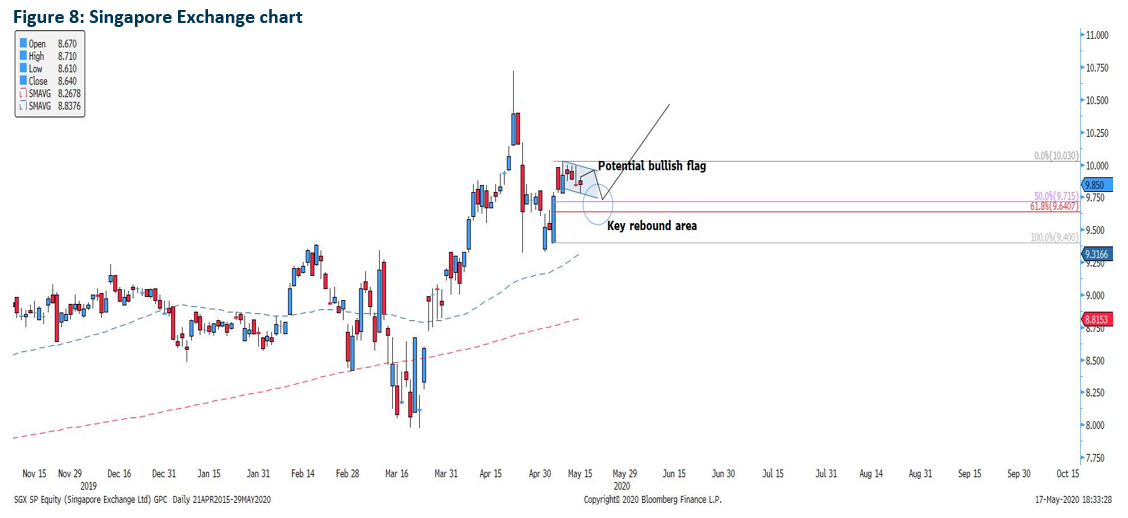
SGX’s strong rally saw a strong breakout at $10.00 psychological resistance level with prices testing the yearly high at $10.72. On our report on 8th of May, we see subsequent correction sees price testing the major support at $9.39 and 50% Fibonacci retracement level from $7.97 – $10.72, effectively forming a double-bottom.
Prices are seeing consolidation after a strong bullish engulfing candle formation. The consolidation is likely to form a potential bullish flag and key support remains at 61.8% and 50% retracement level of $9.40 – $10.03.
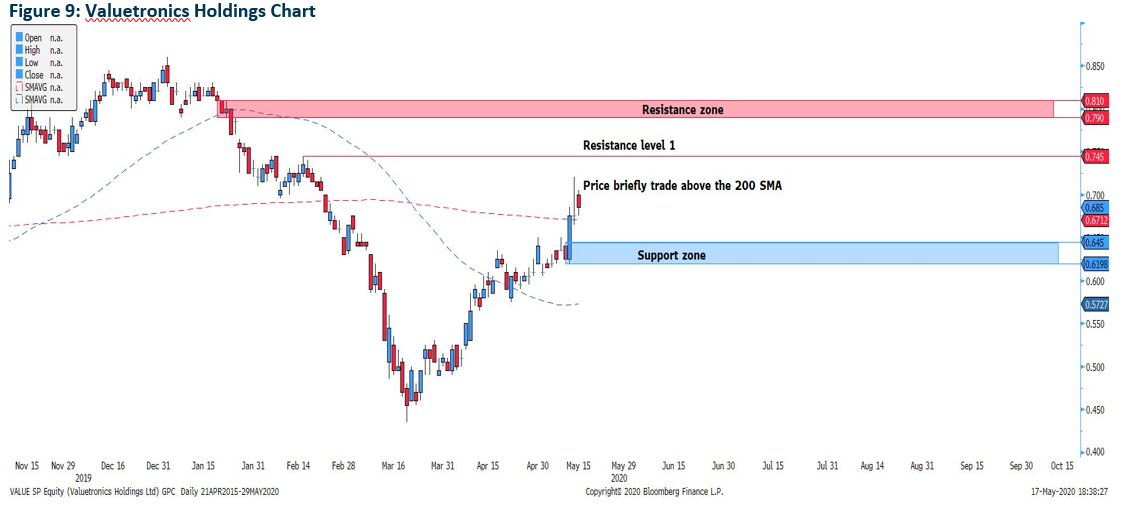
Valuetronics’ strong bullish momentum invalidated the bearish reversal signal which we posted on 13th May 2020. After the strong upside, on Wednesday, the stock formed a graveyard Doji formation. However, to say that the bear has returned is too premature as prices are still trending above the 200 Moving Average. Hence, the immediate support zone between $0.619 – $0.645 is a key rebound zone to test the $0.745 immediate resistance.
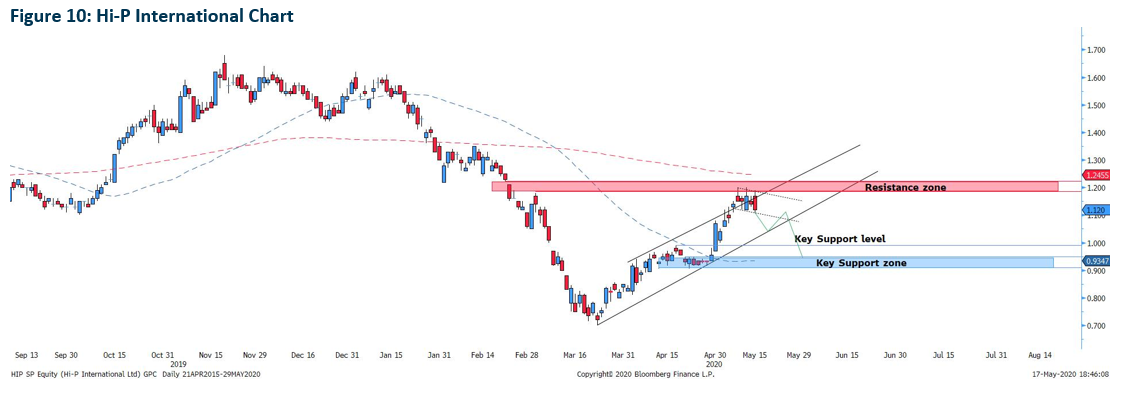
Hi-P’s strong rise had experienced a continued rally as mentioned on our report update on 4th May with prices testing the resistance zone at $1.13-$1.20 region after a rebound at $1.00 psychological support level. Prices remain to trade below the 200 Moving Average but is well above the 50 Moving Average. Hence, there is possibility of the stock prices correcting towards the key support zone at $0.900 – $0.934.
However, there is a strong possibility that the stock may break higher upon market open and should that happen, the stock will most likely validate a bullish flag and test the next resistance at the $1.40 price level.
Important Information
This report is prepared and/or distributed by Phillip Securities Research Pte Ltd ("Phillip Securities Research"), which is a holder of a financial adviser’s licence under the Financial Advisers Act, Chapter 110 in Singapore.
By receiving or reading this report, you agree to be bound by the terms and limitations set out below. Any failure to comply with these terms and limitations may constitute a violation of law. This report has been provided to you for personal use only and shall not be reproduced, distributed or published by you in whole or in part, for any purpose. If you have received this report by mistake, please delete or destroy it, and notify the sender immediately.
The information and any analysis, forecasts, projections, expectations and opinions (collectively, the “Research”) contained in this report has been obtained from public sources which Phillip Securities Research believes to be reliable. However, Phillip Securities Research does not make any representation or warranty, express or implied that such information or Research is accurate, complete or appropriate or should be relied upon as such. Any such information or Research contained in this report is subject to change, and Phillip Securities Research shall not have any responsibility to maintain or update the information or Research made available or to supply any corrections, updates or releases in connection therewith.
Any opinions, forecasts, assumptions, estimates, valuations and prices contained in this report are as of the date indicated and are subject to change at any time without prior notice. Past performance of any product referred to in this report is not indicative of future results.
This report does not constitute, and should not be used as a substitute for, tax, legal or investment advice. This report should not be relied upon exclusively or as authoritative, without further being subject to the recipient’s own independent verification and exercise of judgment. The fact that this report has been made available constitutes neither a recommendation to enter into a particular transaction, nor a representation that any product described in this report is suitable or appropriate for the recipient. Recipients should be aware that many of the products, which may be described in this report involve significant risks and may not be suitable for all investors, and that any decision to enter into transactions involving such products should not be made, unless all such risks are understood and an independent determination has been made that such transactions would be appropriate. Any discussion of the risks contained herein with respect to any product should not be considered to be a disclosure of all risks or a complete discussion of such risks.
Nothing in this report shall be construed to be an offer or solicitation for the purchase or sale of any product. Any decision to purchase any product mentioned in this report should take into account existing public information, including any registered prospectus in respect of such product.
Phillip Securities Research, or persons associated with or connected to Phillip Securities Research, including but not limited to its officers, directors, employees or persons involved in the issuance of this report, may provide an array of financial services to a large number of corporations in Singapore and worldwide, including but not limited to commercial / investment banking activities (including sponsorship, financial advisory or underwriting activities), brokerage or securities trading activities. Phillip Securities Research, or persons associated with or connected to Phillip Securities Research, including but not limited to its officers, directors, employees or persons involved in the issuance of this report, may have participated in or invested in transactions with the issuer(s) of the securities mentioned in this report, and may have performed services for or solicited business from such issuers. Additionally, Phillip Securities Research, or persons associated with or connected to Phillip Securities Research, including but not limited to its officers, directors, employees or persons involved in the issuance of this report, may have provided advice or investment services to such companies and investments or related investments, as may be mentioned in this report.
Phillip Securities Research or persons associated with or connected to Phillip Securities Research, including but not limited to its officers, directors, employees or persons involved in the issuance of this report may, from time to time maintain a long or short position in securities referred to herein, or in related futures or options, purchase or sell, make a market in, or engage in any other transaction involving such securities, and earn brokerage or other compensation in respect of the foregoing. Investments will be denominated in various currencies including US dollars and Euro and thus will be subject to any fluctuation in exchange rates between US dollars and Euro or foreign currencies and the currency of your own jurisdiction. Such fluctuations may have an adverse effect on the value, price or income return of the investment.
To the extent permitted by law, Phillip Securities Research, or persons associated with or connected to Phillip Securities Research, including but not limited to its officers, directors, employees or persons involved in the issuance of this report, may at any time engage in any of the above activities as set out above or otherwise hold an interest, whether material or not, in respect of companies and investments or related investments, which may be mentioned in this report. Accordingly, information may be available to Phillip Securities Research, or persons associated with or connected to Phillip Securities Research, including but not limited to its officers, directors, employees or persons involved in the issuance of this report, which is not reflected in this report, and Phillip Securities Research, or persons associated with or connected to Phillip Securities Research, including but not limited to its officers, directors, employees or persons involved in the issuance of this report, may, to the extent permitted by law, have acted upon or used the information prior to or immediately following its publication. Phillip Securities Research, or persons associated with or connected to Phillip Securities Research, including but not limited its officers, directors, employees or persons involved in the issuance of this report, may have issued other material that is inconsistent with, or reach different conclusions from, the contents of this report.
The information, tools and material presented herein are not directed, intended for distribution to or use by, any person or entity in any jurisdiction or country where such distribution, publication, availability or use would be contrary to the applicable law or regulation or which would subject Phillip Securities Research to any registration or licensing or other requirement, or penalty for contravention of such requirements within such jurisdiction.
This report is intended for general circulation only and does not take into account the specific investment objectives, financial situation or particular needs of any particular person. The products mentioned in this report may not be suitable for all investors and a person receiving or reading this report should seek advice from a professional and financial adviser regarding the legal, business, financial, tax and other aspects including the suitability of such products, taking into account the specific investment objectives, financial situation or particular needs of that person, before making a commitment to invest in any of such products.
This report is not intended for distribution, publication to or use by any person in any jurisdiction outside of Singapore or any other jurisdiction as Phillip Securities Research may determine in its absolute discretion.
IMPORTANT DISCLOSURES FOR INCLUDED RESEARCH ANALYSES OR REPORTS OF FOREIGN RESEARCH HOUSE
Where the report contains research analyses or reports from a foreign research house, please note:
