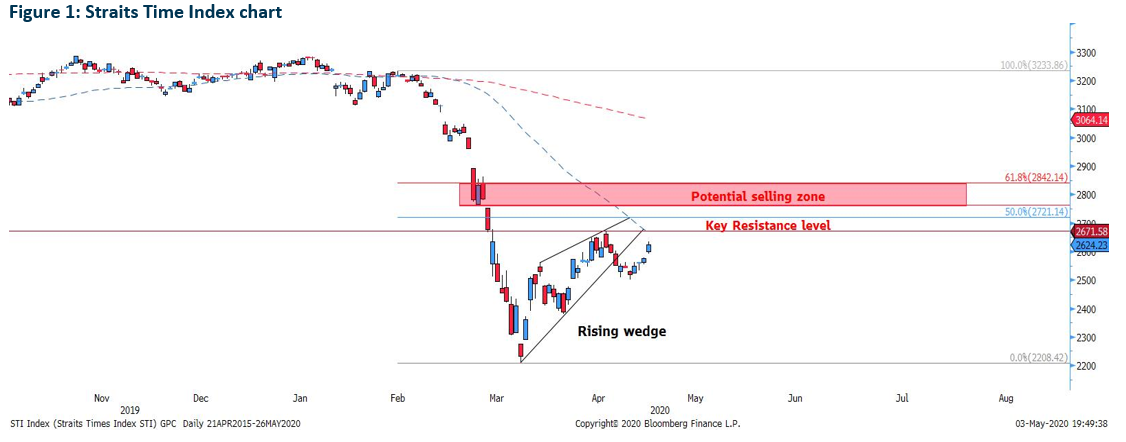
STI had a strong sell-off two weeks ago at 2669 region. Although there is a breakout of the base of the falling wedge, the index recovered its lost ground on the following week with Thursday being the strongest bullish candle. While the rebound from last week from 27th April onward kept the bullish momentum, the ultimate test to confirm a new bull is to break the immediate resistance level at 2671.58 and subsequently the potential selling zone near 61.8% retracement level.
Should price fails to break the immediate resistance and the 50% retracement level by end of this week, there is a strong bearish downside to retest the low at 2208.41.
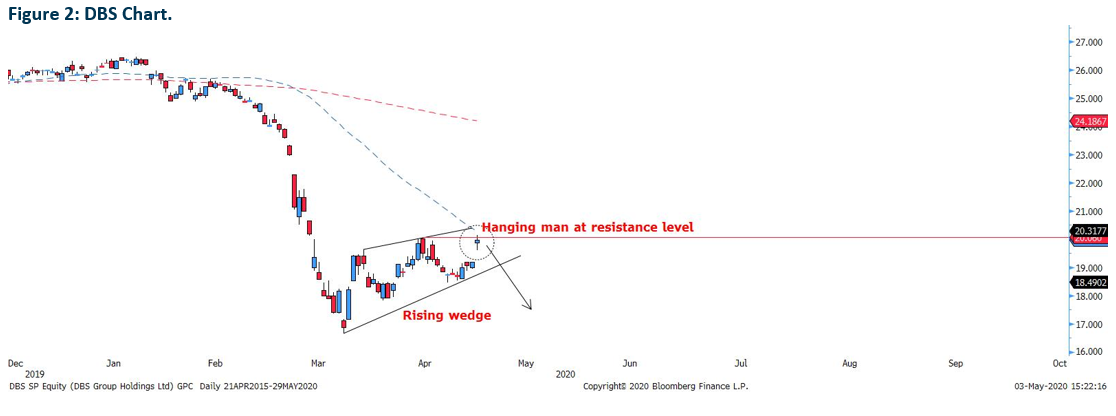
DBS has a strong rally last week and the stellar gap up on last Thursday shows signs of strength after DBS released its results. However, the failure to break the resistance of 20.06 signal a bullish run that is limited in strength. Furthermore, the hanging man at resistance level shows a strong reversal signal and with the rising wedge intact, DBS will resume testing its lower band of the wedge.
To confirm the bullish upside, DBS need to break 21.00 by end of this week, or else the upside will be treated as a false breakout.
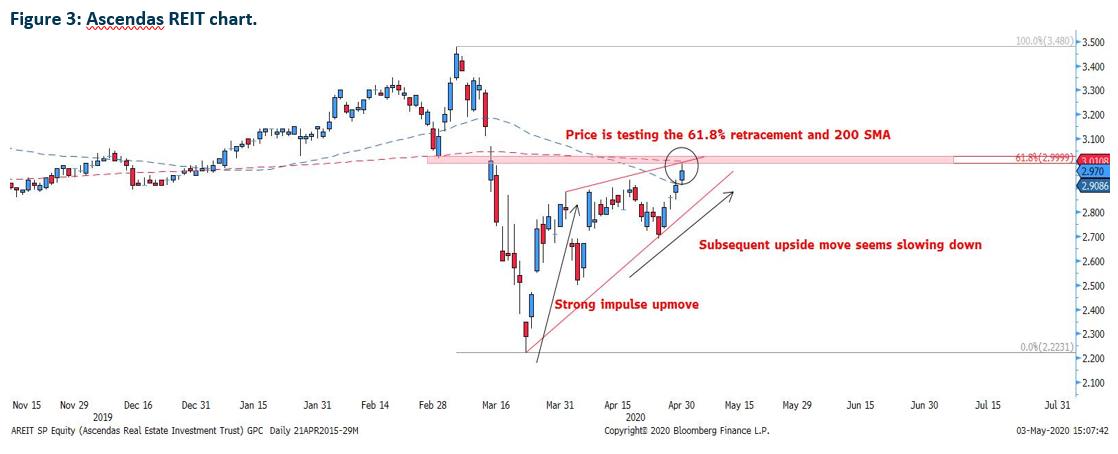
Ascendas REIT enjoyed a strong rebound after breaking the falling wedge mention on April 15th report but subsequent rebound managed to edge above 3.00 on last Thursday’s late morning but the stock closed at 2.97, below the 3.00 psychological level. Analysing the momentum, the rebound between 23rd March to 1st April was a straight-up strong impulse but the subsequent upside was rather slow which can be described by a shallow slope.
Another point to note is that last Thursday’s candle closes below the 61.8% retracement level of the sell-down. Also, the price rejected the 200 moving average line. Another level at 3.07 is a level that poses a potential threat of a renewed sell down.
The only hope of a strong bullish upside is price must break 3.11 level by mid-May, otherwise, the stock will be heading for a renewed sell-off.
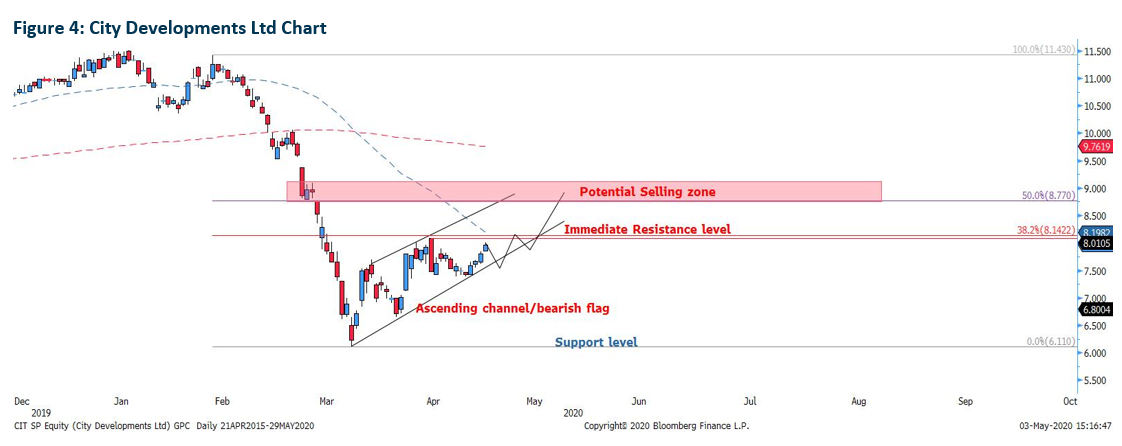
On 16th April, there was a strong signal to for a sell-off after a large bearish engulfing candle emerge. However, price disregarded the signal and continued to edge upwards. Looking closer, the bullish momentum may not be as strong as the market believes as the rebound exhibit a halting of the rise by the smaller bullish candle as compared to Thursday’s strong bullish candle. Another point worthy to note is that price fails to break the top of the bearish engulfing candle at 8.08, which confluence with the 38.2% retracement level of 11.43-6.11.
Although the stock is on a strong downtrend with prices still trending below the 50 and 200 moving average, the true selling may not arrive yet. In other words, there is a strong possibility of the stock rebound at 7.50 towards the potential selling zone at 8.77 after breaking the immediate resistance level at 8.14.
In summary, the main level of the resistance level at 8.14 will determine that stock make or break in the midterm.
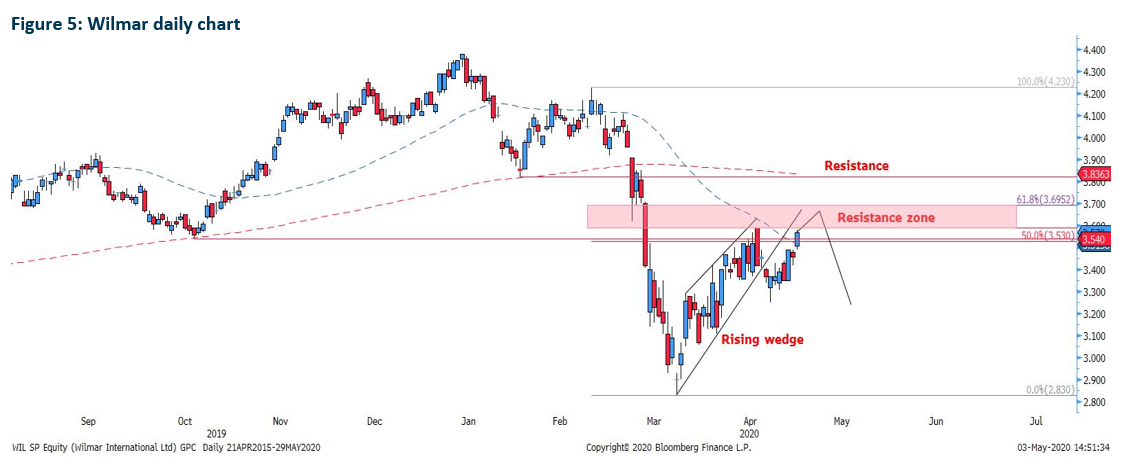
Wilmar close shave from our stop loss level by S$0.01 as reflected on our report on 14th April 2020 is being closely contested once again on last Thursday. In my previous report, we mention that the wave (iv) desired Fibonacci retracement level is at 50% and it has been tested twice, one on 14th and the other on the 17th April with a strong bearish dark cloud cover which sends price lower, below the lower base of the rising wedge. However, prices swiftly rebound on 28th April with a bullish engulfing candle with the subsequent candle breaking above the 50.0% retracement level of wave (iii) and 50 moving average line.
Based on the price action, there is a strong possibility where the price will have a false breakout by testing the resistance zone between 3.60-3.69 region, which confluence strongly with the 61.8% Fibonacci level. Otherwise, Wilmar will reject the 3.60 level.
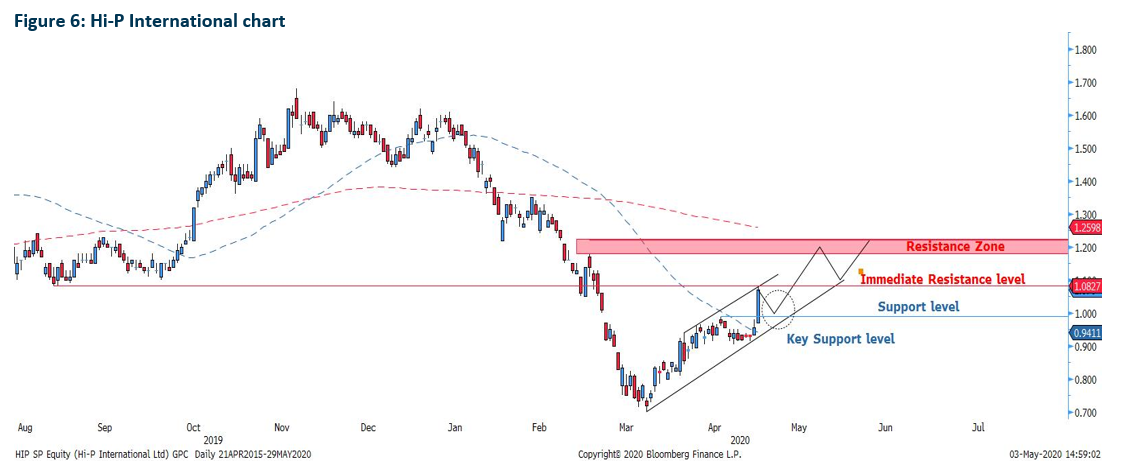
Hi-P had stopped out based on the stop loss level of our report on 21st April and current price action suggest that the strong bull candle on Friday will test and break the immediate resistance level of 1.08 after a rebound from the support level at 1.00. The ultimate test that Hi-P will face is at the resistance zone between 1.13-1.18 region.
To confirm the downside, the price must close below 1.00 support level for 4 consecutive periods.
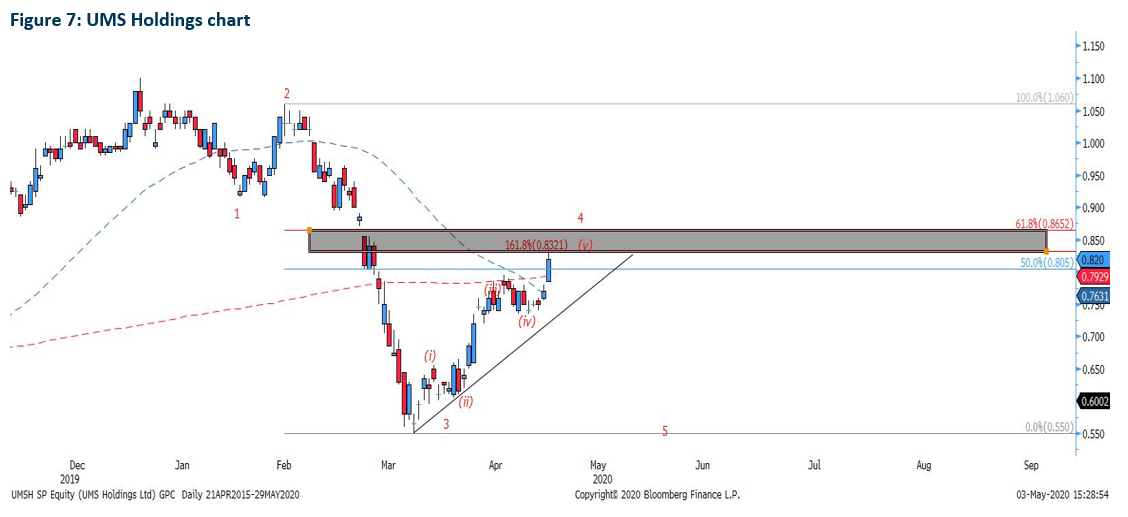
UMS had a strong upside after price gap higher on Thursday and the 4th wave of the larger degree has yet to be complete as compared to our report on 22nd April. As strong as the candle may seem, we believe the stock is heading for a topping out as the price has completed the 5 sub-wave of the minute phase with wave (v) testing at 161.8% of wave (iv). Also, 0.865 – 0.895 region will be a strongly contested selling zone. As such, the following week will be a crucial time to watch out for any signal.
The invalidation of wave 4 will come when price breaks above 0.91, which will directly invalidate the whole wave count.
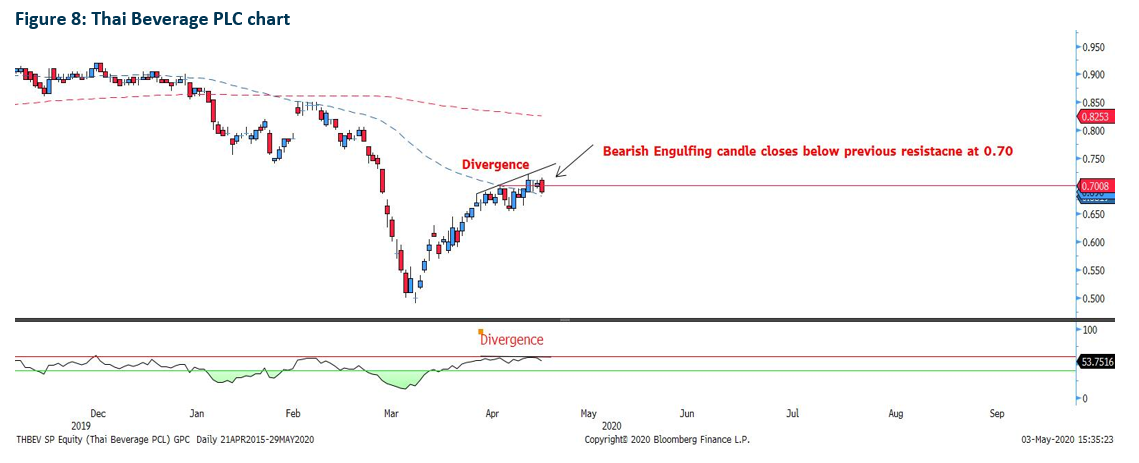
Thai Beverage made an unexpected rebound after our report released on 24th April but the upside is shortlived. As the other Singapore stocks are heading for a strong rally on Friday, ThaiBev exhibit a strong bearish engulfing candle at the previous resistance level of 0.70. Another worthy point to take note is that the bearish divergence has taken place. As such, the strong downside will continue.
Another key resistance level to take note is at 0.74, breaking it will increase the probability of a renewed bullish upside.
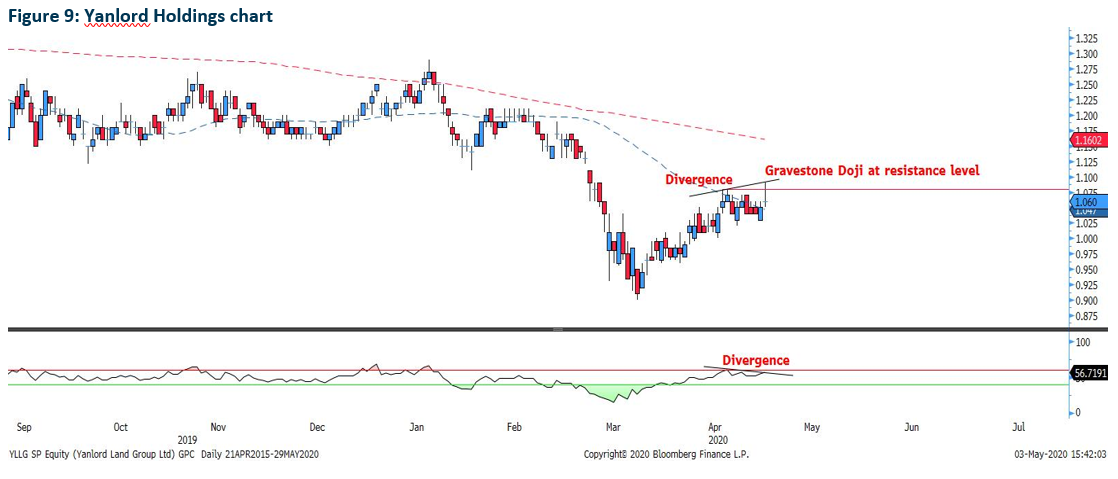
Yanlord made an unexpected rise on Friday with a gap but the afternoon session on Thursday pushed Yanlord prices lower, back below the resistance level which resulted in the formation of the gravestone Doji candle. Another point to note is that the Divergence indicates strong selling ahead.
Important Information
This report is prepared and/or distributed by Phillip Securities Research Pte Ltd ("Phillip Securities Research"), which is a holder of a financial adviser’s licence under the Financial Advisers Act, Chapter 110 in Singapore.
By receiving or reading this report, you agree to be bound by the terms and limitations set out below. Any failure to comply with these terms and limitations may constitute a violation of law. This report has been provided to you for personal use only and shall not be reproduced, distributed or published by you in whole or in part, for any purpose. If you have received this report by mistake, please delete or destroy it, and notify the sender immediately.
The information and any analysis, forecasts, projections, expectations and opinions (collectively, the “Research”) contained in this report has been obtained from public sources which Phillip Securities Research believes to be reliable. However, Phillip Securities Research does not make any representation or warranty, express or implied that such information or Research is accurate, complete or appropriate or should be relied upon as such. Any such information or Research contained in this report is subject to change, and Phillip Securities Research shall not have any responsibility to maintain or update the information or Research made available or to supply any corrections, updates or releases in connection therewith.
Any opinions, forecasts, assumptions, estimates, valuations and prices contained in this report are as of the date indicated and are subject to change at any time without prior notice. Past performance of any product referred to in this report is not indicative of future results.
This report does not constitute, and should not be used as a substitute for, tax, legal or investment advice. This report should not be relied upon exclusively or as authoritative, without further being subject to the recipient’s own independent verification and exercise of judgment. The fact that this report has been made available constitutes neither a recommendation to enter into a particular transaction, nor a representation that any product described in this report is suitable or appropriate for the recipient. Recipients should be aware that many of the products, which may be described in this report involve significant risks and may not be suitable for all investors, and that any decision to enter into transactions involving such products should not be made, unless all such risks are understood and an independent determination has been made that such transactions would be appropriate. Any discussion of the risks contained herein with respect to any product should not be considered to be a disclosure of all risks or a complete discussion of such risks.
Nothing in this report shall be construed to be an offer or solicitation for the purchase or sale of any product. Any decision to purchase any product mentioned in this report should take into account existing public information, including any registered prospectus in respect of such product.
Phillip Securities Research, or persons associated with or connected to Phillip Securities Research, including but not limited to its officers, directors, employees or persons involved in the issuance of this report, may provide an array of financial services to a large number of corporations in Singapore and worldwide, including but not limited to commercial / investment banking activities (including sponsorship, financial advisory or underwriting activities), brokerage or securities trading activities. Phillip Securities Research, or persons associated with or connected to Phillip Securities Research, including but not limited to its officers, directors, employees or persons involved in the issuance of this report, may have participated in or invested in transactions with the issuer(s) of the securities mentioned in this report, and may have performed services for or solicited business from such issuers. Additionally, Phillip Securities Research, or persons associated with or connected to Phillip Securities Research, including but not limited to its officers, directors, employees or persons involved in the issuance of this report, may have provided advice or investment services to such companies and investments or related investments, as may be mentioned in this report.
Phillip Securities Research or persons associated with or connected to Phillip Securities Research, including but not limited to its officers, directors, employees or persons involved in the issuance of this report may, from time to time maintain a long or short position in securities referred to herein, or in related futures or options, purchase or sell, make a market in, or engage in any other transaction involving such securities, and earn brokerage or other compensation in respect of the foregoing. Investments will be denominated in various currencies including US dollars and Euro and thus will be subject to any fluctuation in exchange rates between US dollars and Euro or foreign currencies and the currency of your own jurisdiction. Such fluctuations may have an adverse effect on the value, price or income return of the investment.
To the extent permitted by law, Phillip Securities Research, or persons associated with or connected to Phillip Securities Research, including but not limited to its officers, directors, employees or persons involved in the issuance of this report, may at any time engage in any of the above activities as set out above or otherwise hold an interest, whether material or not, in respect of companies and investments or related investments, which may be mentioned in this report. Accordingly, information may be available to Phillip Securities Research, or persons associated with or connected to Phillip Securities Research, including but not limited to its officers, directors, employees or persons involved in the issuance of this report, which is not reflected in this report, and Phillip Securities Research, or persons associated with or connected to Phillip Securities Research, including but not limited to its officers, directors, employees or persons involved in the issuance of this report, may, to the extent permitted by law, have acted upon or used the information prior to or immediately following its publication. Phillip Securities Research, or persons associated with or connected to Phillip Securities Research, including but not limited its officers, directors, employees or persons involved in the issuance of this report, may have issued other material that is inconsistent with, or reach different conclusions from, the contents of this report.
The information, tools and material presented herein are not directed, intended for distribution to or use by, any person or entity in any jurisdiction or country where such distribution, publication, availability or use would be contrary to the applicable law or regulation or which would subject Phillip Securities Research to any registration or licensing or other requirement, or penalty for contravention of such requirements within such jurisdiction.
This report is intended for general circulation only and does not take into account the specific investment objectives, financial situation or particular needs of any particular person. The products mentioned in this report may not be suitable for all investors and a person receiving or reading this report should seek advice from a professional and financial adviser regarding the legal, business, financial, tax and other aspects including the suitability of such products, taking into account the specific investment objectives, financial situation or particular needs of that person, before making a commitment to invest in any of such products.
This report is not intended for distribution, publication to or use by any person in any jurisdiction outside of Singapore or any other jurisdiction as Phillip Securities Research may determine in its absolute discretion.
IMPORTANT DISCLOSURES FOR INCLUDED RESEARCH ANALYSES OR REPORTS OF FOREIGN RESEARCH HOUSE
Where the report contains research analyses or reports from a foreign research house, please note:
