
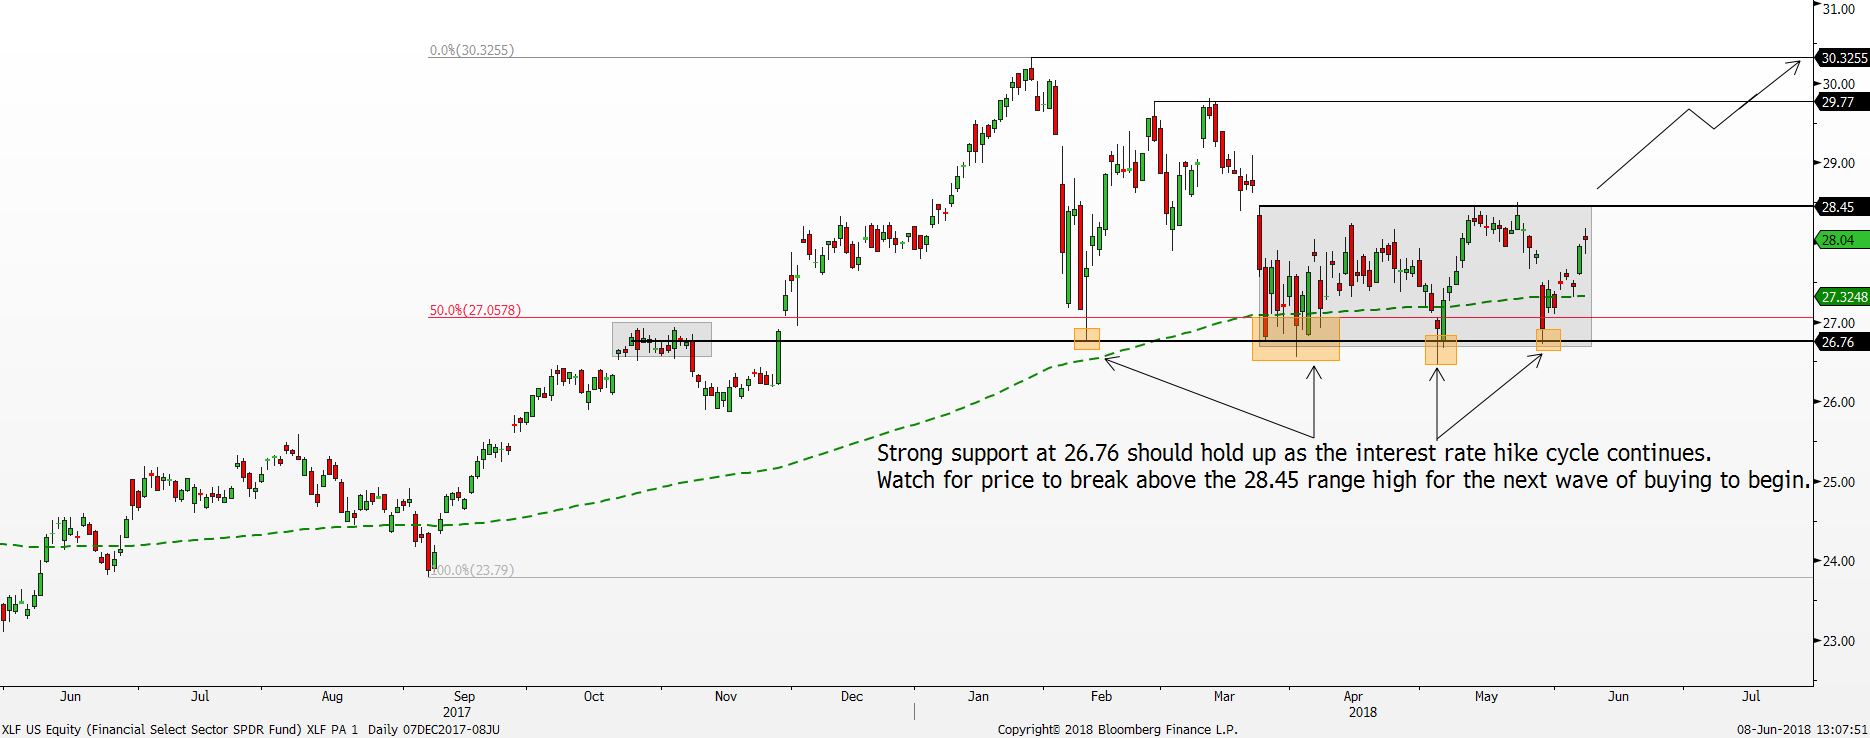
Green line = 200 day moving average
XLF Daily Chart Source: Bloomberg, PSR
With another interest rate hike upon us, we expect the US bank stocks to perform well as the Net Interest Margins (NIMs) continue to expand. The Fed will commence their two-day meeting on 12 June. Based on the Fed Fund Futures, there is a 100% probability of a 0.25% interest rate hike, and that will lift the Fed Funds Rate (FFR) from 1.75% to 2.00%. As the interest rate hike cycle continues, we expect banks to report greater profitability in the coming quarters. Net interest margin simply measures the bank’s profitability. The wider it is, the greater the profitability.
Generally, there is a strong positive correlation between the interest rate hike cycle and the bank stocks. For this article, we will be referencing the Financial Select Sector SPDR (XLF) as the proxy for the US bank stocks. XLF is an ETF that includes financial service firms whose business’ range from investment management to commercial and business banking. The last time the Fed began the rate hike cycle was in July 2004. The rate hike cycle lasted for two years where the Fed Funds Rate (FFR) rose from 1.00% to 5.25%. The resulting impact on the XLF was a 32% rally. Moving to current time, the most recent rate hike cycle that began in December 2015 has also lifted the bank stocks. Since the first rate hike in December 2015, there was five more 0.25% rate hike to date bringing the FFR to 1.75% currently. As the FFR moved higher, NIMs also widened along with it and hence, the XLF rallied +38% during this rate hike cycle.
According to the most recent Fed’s dot-plot projection, the FFR should be at 2.125% by the end of 2018 and 2.875% by the end of 2019. All in, we can still expect this current rate hike cycle to sustain, and that should continue to help with the expansion of NIMs.
Looking at the XLF charts shows a key support area coming into the spotlight. The banking stocks are currently at a major crossroad as it hovers around the $26.76 support area. The recent price actions around the $26.76 support area confirmed the importance of this level. It was first established in October 2017 as resistance as it caused a near-term top back then. However, after a strong performance in December, the bulls broke above the $26.76 resistance area and had since then become a pivotal support area. The staggering -11% selloff in February was halted impeccably by the $26.76 resistance turned support area. Since then, there was three more strong bullish rejection off that support area shown by the highlighted boxes suggesting the bulls are defending that area at all costs. One can view the $26.76 area as a floor on price that prevents it from falling lower. Thus, it can be treated as a dividing line between the bulls and the bears. If price stays above $26.76, the uptrend remains intact. However, if XLF closes below the $26.76 support area, the uptrend might turn into an immediate downtrend where further downside pressure can be expected.
The $26.76 support area happened to be at the 50% Fibonacci retracement level too using the upswing from April 2017, hence reinforcing this support area as a sturdy one.
Therefore, with the expectation of seeing this interest rate hike sustaining into 2019, expect the solid floor at $26.76 to hold and propel XLF back into the uptrend. For the bullish narrative to play out in full force, the XLF needs to break and close above the $28.45 range high. Once that happens, the next leg of buying should begin where the bulls aim for the $29.77 resistance area followed by $30.32 record high.
Important Information
This report is prepared and/or distributed by Phillip Securities Research Pte Ltd ("Phillip Securities Research"), which is a holder of a financial adviser’s licence under the Financial Advisers Act, Chapter 110 in Singapore.
By receiving or reading this report, you agree to be bound by the terms and limitations set out below. Any failure to comply with these terms and limitations may constitute a violation of law. This report has been provided to you for personal use only and shall not be reproduced, distributed or published by you in whole or in part, for any purpose. If you have received this report by mistake, please delete or destroy it, and notify the sender immediately.
The information and any analysis, forecasts, projections, expectations and opinions (collectively, the “Research”) contained in this report has been obtained from public sources which Phillip Securities Research believes to be reliable. However, Phillip Securities Research does not make any representation or warranty, express or implied that such information or Research is accurate, complete or appropriate or should be relied upon as such. Any such information or Research contained in this report is subject to change, and Phillip Securities Research shall not have any responsibility to maintain or update the information or Research made available or to supply any corrections, updates or releases in connection therewith.
Any opinions, forecasts, assumptions, estimates, valuations and prices contained in this report are as of the date indicated and are subject to change at any time without prior notice. Past performance of any product referred to in this report is not indicative of future results.
This report does not constitute, and should not be used as a substitute for, tax, legal or investment advice. This report should not be relied upon exclusively or as authoritative, without further being subject to the recipient’s own independent verification and exercise of judgment. The fact that this report has been made available constitutes neither a recommendation to enter into a particular transaction, nor a representation that any product described in this report is suitable or appropriate for the recipient. Recipients should be aware that many of the products, which may be described in this report involve significant risks and may not be suitable for all investors, and that any decision to enter into transactions involving such products should not be made, unless all such risks are understood and an independent determination has been made that such transactions would be appropriate. Any discussion of the risks contained herein with respect to any product should not be considered to be a disclosure of all risks or a complete discussion of such risks.
Nothing in this report shall be construed to be an offer or solicitation for the purchase or sale of any product. Any decision to purchase any product mentioned in this report should take into account existing public information, including any registered prospectus in respect of such product.
Phillip Securities Research, or persons associated with or connected to Phillip Securities Research, including but not limited to its officers, directors, employees or persons involved in the issuance of this report, may provide an array of financial services to a large number of corporations in Singapore and worldwide, including but not limited to commercial / investment banking activities (including sponsorship, financial advisory or underwriting activities), brokerage or securities trading activities. Phillip Securities Research, or persons associated with or connected to Phillip Securities Research, including but not limited to its officers, directors, employees or persons involved in the issuance of this report, may have participated in or invested in transactions with the issuer(s) of the securities mentioned in this report, and may have performed services for or solicited business from such issuers. Additionally, Phillip Securities Research, or persons associated with or connected to Phillip Securities Research, including but not limited to its officers, directors, employees or persons involved in the issuance of this report, may have provided advice or investment services to such companies and investments or related investments, as may be mentioned in this report.
Phillip Securities Research or persons associated with or connected to Phillip Securities Research, including but not limited to its officers, directors, employees or persons involved in the issuance of this report may, from time to time maintain a long or short position in securities referred to herein, or in related futures or options, purchase or sell, make a market in, or engage in any other transaction involving such securities, and earn brokerage or other compensation in respect of the foregoing. Investments will be denominated in various currencies including US dollars and Euro and thus will be subject to any fluctuation in exchange rates between US dollars and Euro or foreign currencies and the currency of your own jurisdiction. Such fluctuations may have an adverse effect on the value, price or income return of the investment.
To the extent permitted by law, Phillip Securities Research, or persons associated with or connected to Phillip Securities Research, including but not limited to its officers, directors, employees or persons involved in the issuance of this report, may at any time engage in any of the above activities as set out above or otherwise hold an interest, whether material or not, in respect of companies and investments or related investments, which may be mentioned in this report. Accordingly, information may be available to Phillip Securities Research, or persons associated with or connected to Phillip Securities Research, including but not limited to its officers, directors, employees or persons involved in the issuance of this report, which is not reflected in this report, and Phillip Securities Research, or persons associated with or connected to Phillip Securities Research, including but not limited to its officers, directors, employees or persons involved in the issuance of this report, may, to the extent permitted by law, have acted upon or used the information prior to or immediately following its publication. Phillip Securities Research, or persons associated with or connected to Phillip Securities Research, including but not limited its officers, directors, employees or persons involved in the issuance of this report, may have issued other material that is inconsistent with, or reach different conclusions from, the contents of this report.
The information, tools and material presented herein are not directed, intended for distribution to or use by, any person or entity in any jurisdiction or country where such distribution, publication, availability or use would be contrary to the applicable law or regulation or which would subject Phillip Securities Research to any registration or licensing or other requirement, or penalty for contravention of such requirements within such jurisdiction.
This report is intended for general circulation only and does not take into account the specific investment objectives, financial situation or particular needs of any particular person. The products mentioned in this report may not be suitable for all investors and a person receiving or reading this report should seek advice from a professional and financial adviser regarding the legal, business, financial, tax and other aspects including the suitability of such products, taking into account the specific investment objectives, financial situation or particular needs of that person, before making a commitment to invest in any of such products.
This report is not intended for distribution, publication to or use by any person in any jurisdiction outside of Singapore or any other jurisdiction as Phillip Securities Research may determine in its absolute discretion.
IMPORTANT DISCLOSURES FOR INCLUDED RESEARCH ANALYSES OR REPORTS OF FOREIGN RESEARCH HOUSE
Where the report contains research analyses or reports from a foreign research house, please note:

Jeremy specialises in Technical Analysis and has 10 years of experience in studying price action. His areas of expertise include intermarket analysis on the equities, currencies, commodities and bonds market.
He is also a regular columnist on The Business Times - every Monday ChartPoint column.
He graduated with a Bachelor of Science in Banking and Finance from University of London.
