
This article was published in Business Times’ column “Chart Point” on 4 June 2018.
XLE Weekly Chart Source: Bloomberg, PSR
With the recent news on possible easing of output restrictions in the June OPEC meeting, oil tumbled hard on 25 May. WTI and Brent crude oil fell as much as -4.4% and -3.2% respectively. Both Russia and Saudi Arabia mentioned that they are likely to add to production output in H2 2018 to pick up the slack from Venezuela and Iran. Interestingly, the $80.00 psychological round number resistance area appeared to be a major roadblock for the bulls for Brent crude oil. There was two major rejection off the $80.00 round number in May which led to the current selloff. Thus, we expect the $80.00 round number to be the immediate top for Brent crude oil and for a new downtrend to begin as the long squeeze unfolds.
Currently, the net speculators positioning in the oil futures are still at a record high suggesting the crowd is still extremely long oil. Historically, the net speculator positioning provides a reliable contrarian signal when their positions are at either extreme. The masses tend to get it wrong when everyone is betting on the same side. Hence, with the recent selloff in oil, we expect more long speculators to unwind their long trades, and that should in turn result in the long squeeze in oil leading to the start of a new downtrend.
Shifting the attention over to the oil stocks also shows a similar topping formation. We will be referencing the Energy Select Sector SPDR ETF (XLE) for this illustration. XLE is an ETF that holds large-cap US energy stocks that develop & produce crude oil and natural gas, provide drilling and other energy-related services. Both the top line and bottom line of the oil companies are highly dependent on the oil price. Hence, there is a very strong positive correlation between oil price and the oil stocks. Simply put, oil price leads the performance of the oil stocks to a certain extent.
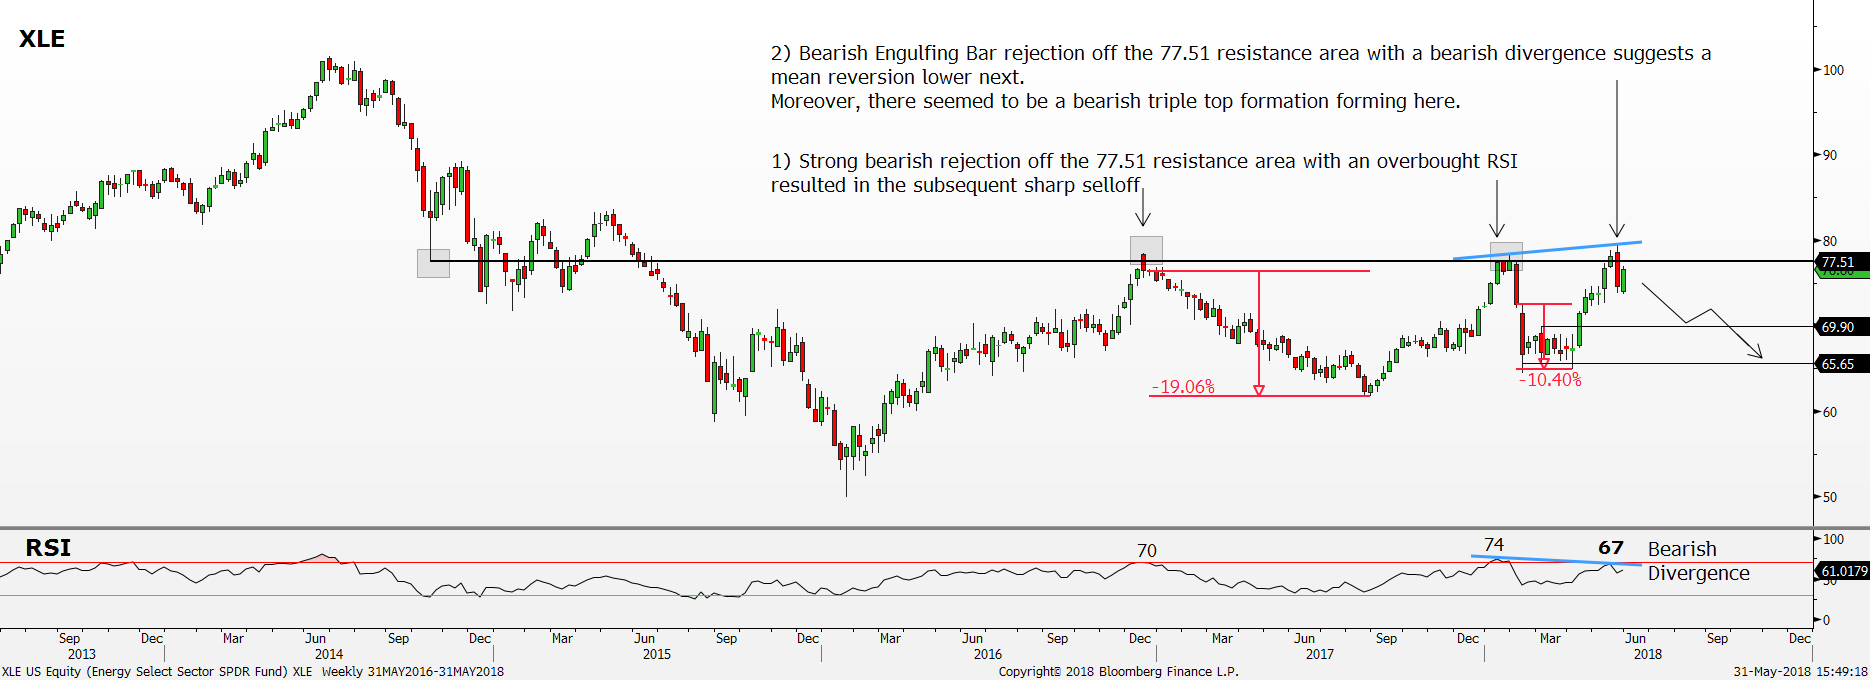
The long-term view of the XLE chart looks bleak with the recent selloff. The area of interest that came into the spotlight was the $77.51 resistance area. It was first established in October 2014 as support and have since then acted as a ceiling, preventing XLE from breaking above it shown by the highlighted boxes in the chart. Another interesting observation was how the XLE tends to mean revert after the Relative Strength Index (RSI) enters into an overbought condition. RSI measures momentum. Any reading above 70 represents overbought condition while any reading below 30 represents oversold condition.
The past two times when the RSI was overbought, above 70, it happened with the XLE trading at the key resistance area of $77.51. Once the bearish price action appeared with the RSI closing back below 70, the mean reversion lower happened, resulting in a –19% and –10% selloff respectively.
Looking at the recent price action also shows a similar pattern forming. Even though the RSI failed to enter into overbought condition as XLE broke above the key $77.51 resistance area on the week ended 18 May, the RSI was still at the high side of 67. More importantly, a RSI bearish divergence is forming with the recent sharp selloff in the week ended 25 May. Moving back to the week ended 12 January was when the RSI hit a high of 74 while XLE hit a high of $77.62. Fast forward to today, with a strong bearish price action (Bearish Engulfing Bar) rejecting the $77.51 resistance area, the RSI bearish divergence is confirmed, signalling for a larger move lower. On the week ended 18 May, the RSI formed a Lower High at 67 while the XLE formed a Higher High at $78.82.
Therefore, with the expectation of a bigger long squeeze happening in the oil complex where oil price should revert lower, a similar move lower should also happen in the XLE. The current bearish triple top rejection off the critical $77.51 resistance area and a bearish divergence formation suggest a mean reversion lower for the XLE. For this leg down, expect the XLE to test the $69.90 support area followed by $65.65.
Keep a close look out on the further developments in the OPEC meeting that is scheduled to happen on 22 June. That will be the main catalyst that will drive the near-term move in oil.
Important Information
This report is prepared and/or distributed by Phillip Securities Research Pte Ltd ("Phillip Securities Research"), which is a holder of a financial adviser’s licence under the Financial Advisers Act, Chapter 110 in Singapore.
By receiving or reading this report, you agree to be bound by the terms and limitations set out below. Any failure to comply with these terms and limitations may constitute a violation of law. This report has been provided to you for personal use only and shall not be reproduced, distributed or published by you in whole or in part, for any purpose. If you have received this report by mistake, please delete or destroy it, and notify the sender immediately.
The information and any analysis, forecasts, projections, expectations and opinions (collectively, the “Research”) contained in this report has been obtained from public sources which Phillip Securities Research believes to be reliable. However, Phillip Securities Research does not make any representation or warranty, express or implied that such information or Research is accurate, complete or appropriate or should be relied upon as such. Any such information or Research contained in this report is subject to change, and Phillip Securities Research shall not have any responsibility to maintain or update the information or Research made available or to supply any corrections, updates or releases in connection therewith.
Any opinions, forecasts, assumptions, estimates, valuations and prices contained in this report are as of the date indicated and are subject to change at any time without prior notice. Past performance of any product referred to in this report is not indicative of future results.
This report does not constitute, and should not be used as a substitute for, tax, legal or investment advice. This report should not be relied upon exclusively or as authoritative, without further being subject to the recipient’s own independent verification and exercise of judgment. The fact that this report has been made available constitutes neither a recommendation to enter into a particular transaction, nor a representation that any product described in this report is suitable or appropriate for the recipient. Recipients should be aware that many of the products, which may be described in this report involve significant risks and may not be suitable for all investors, and that any decision to enter into transactions involving such products should not be made, unless all such risks are understood and an independent determination has been made that such transactions would be appropriate. Any discussion of the risks contained herein with respect to any product should not be considered to be a disclosure of all risks or a complete discussion of such risks.
Nothing in this report shall be construed to be an offer or solicitation for the purchase or sale of any product. Any decision to purchase any product mentioned in this report should take into account existing public information, including any registered prospectus in respect of such product.
Phillip Securities Research, or persons associated with or connected to Phillip Securities Research, including but not limited to its officers, directors, employees or persons involved in the issuance of this report, may provide an array of financial services to a large number of corporations in Singapore and worldwide, including but not limited to commercial / investment banking activities (including sponsorship, financial advisory or underwriting activities), brokerage or securities trading activities. Phillip Securities Research, or persons associated with or connected to Phillip Securities Research, including but not limited to its officers, directors, employees or persons involved in the issuance of this report, may have participated in or invested in transactions with the issuer(s) of the securities mentioned in this report, and may have performed services for or solicited business from such issuers. Additionally, Phillip Securities Research, or persons associated with or connected to Phillip Securities Research, including but not limited to its officers, directors, employees or persons involved in the issuance of this report, may have provided advice or investment services to such companies and investments or related investments, as may be mentioned in this report.
Phillip Securities Research or persons associated with or connected to Phillip Securities Research, including but not limited to its officers, directors, employees or persons involved in the issuance of this report may, from time to time maintain a long or short position in securities referred to herein, or in related futures or options, purchase or sell, make a market in, or engage in any other transaction involving such securities, and earn brokerage or other compensation in respect of the foregoing. Investments will be denominated in various currencies including US dollars and Euro and thus will be subject to any fluctuation in exchange rates between US dollars and Euro or foreign currencies and the currency of your own jurisdiction. Such fluctuations may have an adverse effect on the value, price or income return of the investment.
To the extent permitted by law, Phillip Securities Research, or persons associated with or connected to Phillip Securities Research, including but not limited to its officers, directors, employees or persons involved in the issuance of this report, may at any time engage in any of the above activities as set out above or otherwise hold an interest, whether material or not, in respect of companies and investments or related investments, which may be mentioned in this report. Accordingly, information may be available to Phillip Securities Research, or persons associated with or connected to Phillip Securities Research, including but not limited to its officers, directors, employees or persons involved in the issuance of this report, which is not reflected in this report, and Phillip Securities Research, or persons associated with or connected to Phillip Securities Research, including but not limited to its officers, directors, employees or persons involved in the issuance of this report, may, to the extent permitted by law, have acted upon or used the information prior to or immediately following its publication. Phillip Securities Research, or persons associated with or connected to Phillip Securities Research, including but not limited its officers, directors, employees or persons involved in the issuance of this report, may have issued other material that is inconsistent with, or reach different conclusions from, the contents of this report.
The information, tools and material presented herein are not directed, intended for distribution to or use by, any person or entity in any jurisdiction or country where such distribution, publication, availability or use would be contrary to the applicable law or regulation or which would subject Phillip Securities Research to any registration or licensing or other requirement, or penalty for contravention of such requirements within such jurisdiction.
This report is intended for general circulation only and does not take into account the specific investment objectives, financial situation or particular needs of any particular person. The products mentioned in this report may not be suitable for all investors and a person receiving or reading this report should seek advice from a professional and financial adviser regarding the legal, business, financial, tax and other aspects including the suitability of such products, taking into account the specific investment objectives, financial situation or particular needs of that person, before making a commitment to invest in any of such products.
This report is not intended for distribution, publication to or use by any person in any jurisdiction outside of Singapore or any other jurisdiction as Phillip Securities Research may determine in its absolute discretion.
IMPORTANT DISCLOSURES FOR INCLUDED RESEARCH ANALYSES OR REPORTS OF FOREIGN RESEARCH HOUSE
Where the report contains research analyses or reports from a foreign research house, please note:

Jeremy specialises in Technical Analysis and has 10 years of experience in studying price action. His areas of expertise include intermarket analysis on the equities, currencies, commodities and bonds market.
He is also a regular columnist on The Business Times - every Monday ChartPoint column.
He graduated with a Bachelor of Science in Banking and Finance from University of London.
