
This article was published in Business Times’ column “Chart Point” on 15 January 2018.
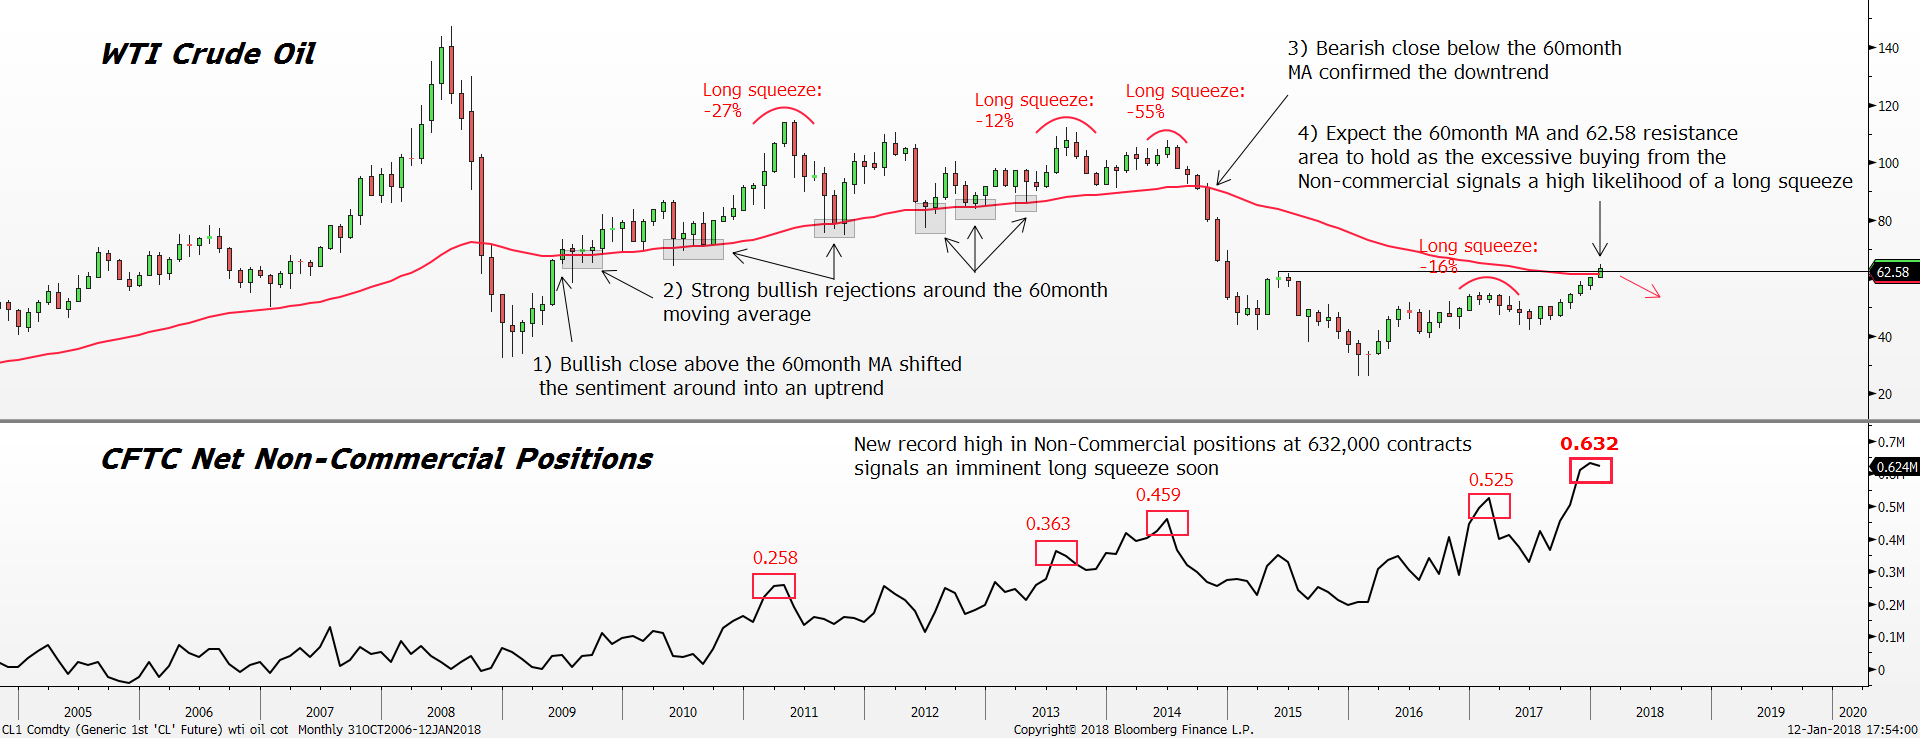
WTI crude oil vs COT Non-Commercial Futures positions Monthly Chart Source: Bloomberg, PSR
*red highlighted box shows the period where the record long bets in the Non-Commercial group led to long squeeze
*red line = 60 month moving average
For the past four months, West Texas Intermediate Crude (WTI) oil has made remarkable progress to the upside. Despite the recent rally, we believe there might be limited upside ahead as the confluence of 60-month moving average and 62.58 resistance area stands in the way. As WTI oil tests the critical resistance area, a reversal lower is expected with the extremely concentrated long bets showing up on the Commitment of Traders (COT) Non-Commercial Futures positions.
Notice how reactive WTI oil is to the 60-month moving average since June 2009 shown by the grey highlighted areas. There seemed to be a special relationship between them, making the 60-month moving average a crucial signal to watch. A general rule of thumb for the existing uptrend to remain intact is to have price staying above the 60-month moving average, vice versa. For example, after WTI oil price closed above the 60-month moving average (67.80) in June 2009, the uptrend was confirmed. The subsequent moves higher were all supported by the 60-month moving average shown by the grey highlighted areas even though there were some intra-month lows below the 60-month moving average. The closing price for the month is all that matters. In total, there were 19 occasions where the 60-month moving average defended the uptrend successfully. This pattern lasted until September 2014 where the sellers finally managed to close price below the 60-month moving average (91.37). As a result, the prior uptrend was reversed to the downside significantly. It took the bears a whopping five years before shifting the trend around to the downside.
With the help of the OPEC and Russia to extend the oil cut to the end of 2018, WTI oil succeeded in breaking above the 60.00 psychological barrier. However, the recent rally has also lifted price back to the pivotal point of 60-month moving average. Moreover, the 60-month moving average also coincided with the May 2015 high of 62.58, making this a stronger resistance area. As long as WTI oil price fails to close above the 60-month moving average, the long-term downtrend should continue to weigh down on price. The January close will be an important month to watch to see if the bulls manage to close price above the 60-month moving average.
There were other important details in the current COT report. With the rise in oil price, it attracted more bullish bets on higher prices. The most recent reading of the COT crude oil net Non-Commercial Futures positions report has reached yet another new record high 624,000 contract. Non-Commercial traders tend to provide a contrarian signal when the data exceeds into the extreme zones (overcrowded trade). With so much consensus trade piling on to the same bet, long squeeze tends to happen. Long squeeze is the situation where buyers are forced to sell due to dramatic drop in price, leading to further selling by other overcrowded buyers. The overcrowded buying scenario can be seen by the Non-Commercial Futures position breaking into new record highs.
For example, the excessive bullish bets in July 2014 and March 2017 where the Non-Commercial Futures positions entered into all-time high at 459,000 and 525,000 contracts respectively. As soon as some market weakness appeared, long squeeze took place as the vulnerable bulls are forced to sell. During both episodes, the long squeeze led to a 55% and 16% selloff. Other examples of long squeezes are shown by the highlighted boxes.
Hence, with the excessive bullish bets on WTI Oil and price testing a pivotal point at the confluence of 60-month moving average and 62.58 resistance area, WTI oil should be forming a near-term top and enter into a period of correction soon. A retest of the 59.00 support area is likely followed by the 55.00 range. Keep in mind the Daily and Weekly Relative Strength Index (RSI) are both overbought as well at 75, pointing to the same conclusion of a correction to the downside soon.
Important Information
This report is prepared and/or distributed by Phillip Securities Research Pte Ltd ("Phillip Securities Research"), which is a holder of a financial adviser’s licence under the Financial Advisers Act, Chapter 110 in Singapore.
By receiving or reading this report, you agree to be bound by the terms and limitations set out below. Any failure to comply with these terms and limitations may constitute a violation of law. This report has been provided to you for personal use only and shall not be reproduced, distributed or published by you in whole or in part, for any purpose. If you have received this report by mistake, please delete or destroy it, and notify the sender immediately.
The information and any analysis, forecasts, projections, expectations and opinions (collectively, the “Research”) contained in this report has been obtained from public sources which Phillip Securities Research believes to be reliable. However, Phillip Securities Research does not make any representation or warranty, express or implied that such information or Research is accurate, complete or appropriate or should be relied upon as such. Any such information or Research contained in this report is subject to change, and Phillip Securities Research shall not have any responsibility to maintain or update the information or Research made available or to supply any corrections, updates or releases in connection therewith.
Any opinions, forecasts, assumptions, estimates, valuations and prices contained in this report are as of the date indicated and are subject to change at any time without prior notice. Past performance of any product referred to in this report is not indicative of future results.
This report does not constitute, and should not be used as a substitute for, tax, legal or investment advice. This report should not be relied upon exclusively or as authoritative, without further being subject to the recipient’s own independent verification and exercise of judgment. The fact that this report has been made available constitutes neither a recommendation to enter into a particular transaction, nor a representation that any product described in this report is suitable or appropriate for the recipient. Recipients should be aware that many of the products, which may be described in this report involve significant risks and may not be suitable for all investors, and that any decision to enter into transactions involving such products should not be made, unless all such risks are understood and an independent determination has been made that such transactions would be appropriate. Any discussion of the risks contained herein with respect to any product should not be considered to be a disclosure of all risks or a complete discussion of such risks.
Nothing in this report shall be construed to be an offer or solicitation for the purchase or sale of any product. Any decision to purchase any product mentioned in this report should take into account existing public information, including any registered prospectus in respect of such product.
Phillip Securities Research, or persons associated with or connected to Phillip Securities Research, including but not limited to its officers, directors, employees or persons involved in the issuance of this report, may provide an array of financial services to a large number of corporations in Singapore and worldwide, including but not limited to commercial / investment banking activities (including sponsorship, financial advisory or underwriting activities), brokerage or securities trading activities. Phillip Securities Research, or persons associated with or connected to Phillip Securities Research, including but not limited to its officers, directors, employees or persons involved in the issuance of this report, may have participated in or invested in transactions with the issuer(s) of the securities mentioned in this report, and may have performed services for or solicited business from such issuers. Additionally, Phillip Securities Research, or persons associated with or connected to Phillip Securities Research, including but not limited to its officers, directors, employees or persons involved in the issuance of this report, may have provided advice or investment services to such companies and investments or related investments, as may be mentioned in this report.
Phillip Securities Research or persons associated with or connected to Phillip Securities Research, including but not limited to its officers, directors, employees or persons involved in the issuance of this report may, from time to time maintain a long or short position in securities referred to herein, or in related futures or options, purchase or sell, make a market in, or engage in any other transaction involving such securities, and earn brokerage or other compensation in respect of the foregoing. Investments will be denominated in various currencies including US dollars and Euro and thus will be subject to any fluctuation in exchange rates between US dollars and Euro or foreign currencies and the currency of your own jurisdiction. Such fluctuations may have an adverse effect on the value, price or income return of the investment.
To the extent permitted by law, Phillip Securities Research, or persons associated with or connected to Phillip Securities Research, including but not limited to its officers, directors, employees or persons involved in the issuance of this report, may at any time engage in any of the above activities as set out above or otherwise hold an interest, whether material or not, in respect of companies and investments or related investments, which may be mentioned in this report. Accordingly, information may be available to Phillip Securities Research, or persons associated with or connected to Phillip Securities Research, including but not limited to its officers, directors, employees or persons involved in the issuance of this report, which is not reflected in this report, and Phillip Securities Research, or persons associated with or connected to Phillip Securities Research, including but not limited to its officers, directors, employees or persons involved in the issuance of this report, may, to the extent permitted by law, have acted upon or used the information prior to or immediately following its publication. Phillip Securities Research, or persons associated with or connected to Phillip Securities Research, including but not limited its officers, directors, employees or persons involved in the issuance of this report, may have issued other material that is inconsistent with, or reach different conclusions from, the contents of this report.
The information, tools and material presented herein are not directed, intended for distribution to or use by, any person or entity in any jurisdiction or country where such distribution, publication, availability or use would be contrary to the applicable law or regulation or which would subject Phillip Securities Research to any registration or licensing or other requirement, or penalty for contravention of such requirements within such jurisdiction.
This report is intended for general circulation only and does not take into account the specific investment objectives, financial situation or particular needs of any particular person. The products mentioned in this report may not be suitable for all investors and a person receiving or reading this report should seek advice from a professional and financial adviser regarding the legal, business, financial, tax and other aspects including the suitability of such products, taking into account the specific investment objectives, financial situation or particular needs of that person, before making a commitment to invest in any of such products.
This report is not intended for distribution, publication to or use by any person in any jurisdiction outside of Singapore or any other jurisdiction as Phillip Securities Research may determine in its absolute discretion.
IMPORTANT DISCLOSURES FOR INCLUDED RESEARCH ANALYSES OR REPORTS OF FOREIGN RESEARCH HOUSE
Where the report contains research analyses or reports from a foreign research house, please note:

Jeremy specialises in Technical Analysis and has 10 years of experience in studying price action. His areas of expertise include intermarket analysis on the equities, currencies, commodities and bonds market.
He is also a regular columnist on The Business Times - every Monday ChartPoint column.
He graduated with a Bachelor of Science in Banking and Finance from University of London.
