The Positives
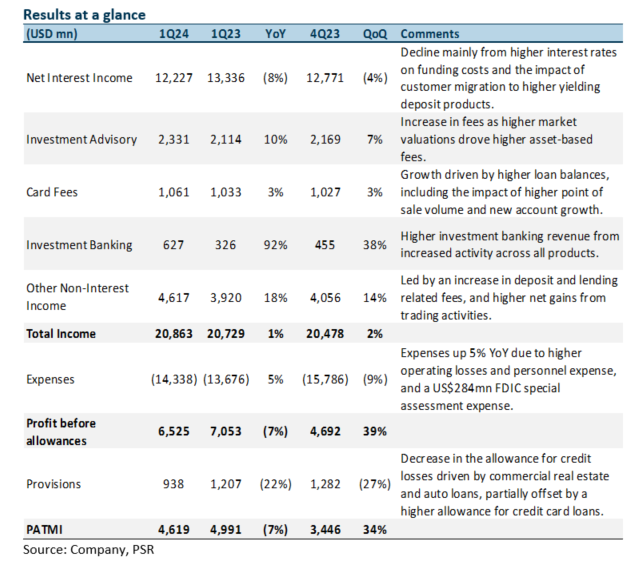
+ Noninterest income grew 17% YoY. Total noninterest income growth came mainly from higher investment advisory fees and brokerage commissions (+8% YoY) as elevated market valuations lifted asset-based fees, deposit and lending-related fees (+6% YoY), net gains from trading activities (+8% YoY), and other noninterest income (+107%) from net gains from equity securities.
+ Investment banking growth lifted CIB revenue. Corporate and investment banking revenue rose 2% YoY to US$5bn, mainly from investment banking fees, which surged 92% YoY from increased activity across all products and higher markets revenue (+2% YoY) driven by higher revenue in structured products, credit products, and foreign exchange, partially offset by lower revenue in rates and commodities. However, this was offset by lower treasury management revenue from higher deposit costs and lower Commercial Real Estate (CRE) revenue, including lower loan balances, partially offset by higher commercial mortgage-backed securities volumes.
+ Provisions fell 22% YoY. Provisions for credit losses fell 22% to US$938mn, which includes net charge-offs of US$1.2bn and allowance for credit losses of –US$219mn (1Q23: net charge-offs of US$564mn and allowance of credit losses of US$643mn). The decline in allowance for credit losses was driven by CRE and auto loans, partially offset by a higher allowance for credit card loans. Net charge-offs rose 105% YoY due to an increase in credit card and commercial & industrial loans partially offset by a decline in CRE and auto. The total net charge-off ratio rose 24bps YoY to 0.50%.
The Negatives
– NII and loans fell YoY. NII fell 8% YoY to US$12.2bn due to the impact of higher interest rates on funding costs, including the impact of customer migration to higher yielding deposit products, as well as lower loan balances, partially offset by higher yields on earning assets. NIMs fell by 39bps YoY to 2.81% as the rise in deposit costs (+91bps YoY) outpaced the growth in loan yield (+69bps YoY). Average loans fell 2% YoY with declines across most loan categories, partially offset by higher credit card loans.
– Expenses up 5% YoY. Noninterest expense rose 5% YoY to US$14.3bn, mainly from higher operating losses (+137%) driven by customer remediation accruals for historical matters, a FDIC special assessment expense of US$284mn for the quarter, and higher personnel expense (+1% YoY) from higher revenue-related compensation expense mainly in Wealth and Investment Management, partially offset by the impact of efficiency initiatives. These increases were offset by lower non-personnel expenses (-2% YoY) from lower professional and outside service expenses.

Glenn covers the Banking and Finance sector. He has had 3 years of experience as a Credit Analyst in a Bank, where he prepared credit proposals by conducting consistent critical analysis on the business, market, country and financial information. Glenn graduated with a Bachelor of Business Management from the University of Queensland with a double major in International Business and Human Resources.
