
This article was published on Business Times’ column “ChartPoint” on 28 August 2017.
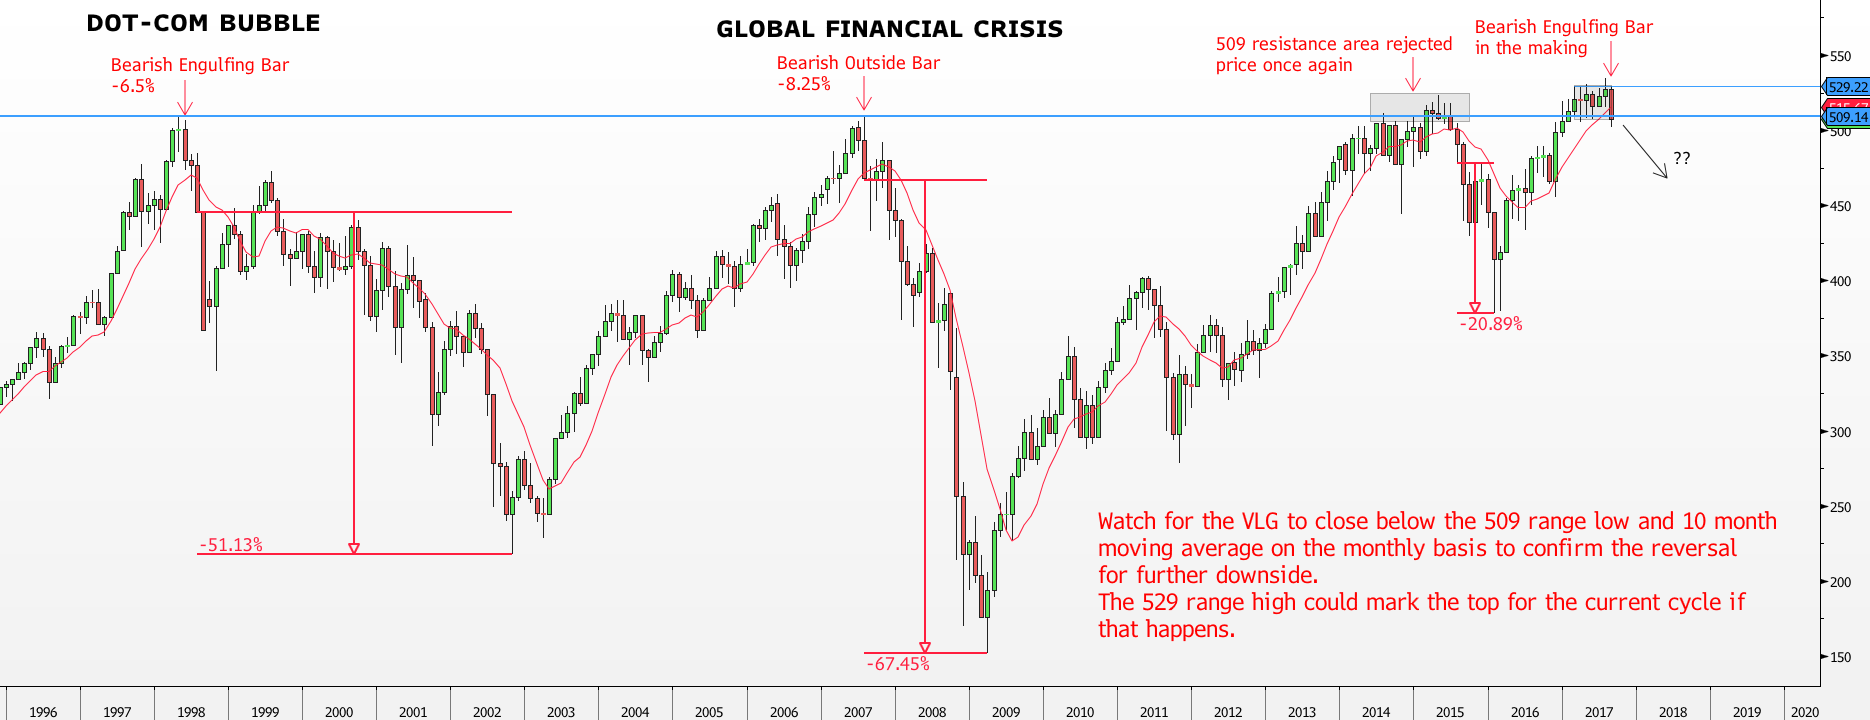
VLG Monthly chart Red line = 10 MA Source: Bloomberg, PSR
With the major US equity indices such as Dow Jones Industrial Average, S&P 500 and Nasdaq 100, breaking record highs, one would expect that the broader market to be performing similarly well. However, looking beneath the surface with the Value Line Geometric Index (VLG), a very different story emerged. We found the market is structurally weak. VLG is a better gauge of the health of all the stocks rather than just the large caps. VLG is derived from an equally weighted index of 1675 companies from the AMEX, NYSE, NASDAQ and OTC market. On the other hand, the DJIA, S&P 500 and Nasdaq 100 are market weighted indices where the big boys dictate the performance.
Most equity indices started rallying extraordinarily since 8 November 2016 after President Trump won the US election where they essentially broke out into new record highs. For instance, the S&P 500 has advanced 16% higher from the 2015 peak while the VLG is still stuck in limbo as it only improved 2% away from the 2015 peak. To make matters worse, the S&P 500 has surpassed the Global Financial Crisis (GFC) high by 57% while the VLG has hardly moved anywhere from the GFC peak. In other words, the major indices are only being held up by a few big boys such as the FAANG (Facebook, Apple, Amazon, Netflix, Google) stocks while the broader market is still lagging behind.
A clear resistance was formed back in the Dot-Com bubble era at 509 points where the VLG had a hard time breaking through. The subsequent rally from 2003 – 2007 was stopped perfectly at the 509 resistance area where the GFC high was established. Moreover, the recent price action in 2015 further confirmed the importance of the Dot-com and GFC 509 resistance area as the VLG entered into another period of correction due to the 509 ceiling, leading to the VLG shedding 27%.
Since the start of this year 2017, the VLG has finally broken above the 509 critical resistance area showing some glimmer of hope, but the bullish momentum appears weak. A newly formed resistance at 529 points eventually capped the bullish move. Put differently, the performance of VLG has been flat for the year as it moved in a ranging manner between the 529 range high and 509 range low while the YTD performance of S&P 500 and Nasdaq 100 are 19% and 8% respectively, showing a great divergence.
What’s interesting now is the new attempt to reverse the trend around as sellers aim to break below the crucial 509 range low. More confirmation of the bearish view will be formalised once the VLG closes below the 509 range low and 10 month moving average on a monthly basis. Notice how the Dot-com and GFC peaks were signalled by significant bearish price action; Bearish Engulfing Bar during Dot-Com peak and Bearish Outside Bar during GFC peak. Bearish Engulfing/Outside bar are bearish reversal candlestick pattern that suggests a future bearish trend.
The current situation is very similar to the previous two episodes where price is currently showing a Bearish Engulfing Bar. If the VLG manages to close with a Bearish Engulfing Bar below the 509 range low at the end of August, we could expect the VLG to make a turnaround and possibly establish a similar top like the one during the Dot-Com and GFC era.
In summary, we do expect the major indices to turn down with the VLG once the bearish confirmation appears.
Important Information
This report is prepared and/or distributed by Phillip Securities Research Pte Ltd ("Phillip Securities Research"), which is a holder of a financial adviser’s licence under the Financial Advisers Act, Chapter 110 in Singapore.
By receiving or reading this report, you agree to be bound by the terms and limitations set out below. Any failure to comply with these terms and limitations may constitute a violation of law. This report has been provided to you for personal use only and shall not be reproduced, distributed or published by you in whole or in part, for any purpose. If you have received this report by mistake, please delete or destroy it, and notify the sender immediately.
The information and any analysis, forecasts, projections, expectations and opinions (collectively, the “Research”) contained in this report has been obtained from public sources which Phillip Securities Research believes to be reliable. However, Phillip Securities Research does not make any representation or warranty, express or implied that such information or Research is accurate, complete or appropriate or should be relied upon as such. Any such information or Research contained in this report is subject to change, and Phillip Securities Research shall not have any responsibility to maintain or update the information or Research made available or to supply any corrections, updates or releases in connection therewith.
Any opinions, forecasts, assumptions, estimates, valuations and prices contained in this report are as of the date indicated and are subject to change at any time without prior notice. Past performance of any product referred to in this report is not indicative of future results.
This report does not constitute, and should not be used as a substitute for, tax, legal or investment advice. This report should not be relied upon exclusively or as authoritative, without further being subject to the recipient’s own independent verification and exercise of judgment. The fact that this report has been made available constitutes neither a recommendation to enter into a particular transaction, nor a representation that any product described in this report is suitable or appropriate for the recipient. Recipients should be aware that many of the products, which may be described in this report involve significant risks and may not be suitable for all investors, and that any decision to enter into transactions involving such products should not be made, unless all such risks are understood and an independent determination has been made that such transactions would be appropriate. Any discussion of the risks contained herein with respect to any product should not be considered to be a disclosure of all risks or a complete discussion of such risks.
Nothing in this report shall be construed to be an offer or solicitation for the purchase or sale of any product. Any decision to purchase any product mentioned in this report should take into account existing public information, including any registered prospectus in respect of such product.
Phillip Securities Research, or persons associated with or connected to Phillip Securities Research, including but not limited to its officers, directors, employees or persons involved in the issuance of this report, may provide an array of financial services to a large number of corporations in Singapore and worldwide, including but not limited to commercial / investment banking activities (including sponsorship, financial advisory or underwriting activities), brokerage or securities trading activities. Phillip Securities Research, or persons associated with or connected to Phillip Securities Research, including but not limited to its officers, directors, employees or persons involved in the issuance of this report, may have participated in or invested in transactions with the issuer(s) of the securities mentioned in this report, and may have performed services for or solicited business from such issuers. Additionally, Phillip Securities Research, or persons associated with or connected to Phillip Securities Research, including but not limited to its officers, directors, employees or persons involved in the issuance of this report, may have provided advice or investment services to such companies and investments or related investments, as may be mentioned in this report.
Phillip Securities Research or persons associated with or connected to Phillip Securities Research, including but not limited to its officers, directors, employees or persons involved in the issuance of this report may, from time to time maintain a long or short position in securities referred to herein, or in related futures or options, purchase or sell, make a market in, or engage in any other transaction involving such securities, and earn brokerage or other compensation in respect of the foregoing. Investments will be denominated in various currencies including US dollars and Euro and thus will be subject to any fluctuation in exchange rates between US dollars and Euro or foreign currencies and the currency of your own jurisdiction. Such fluctuations may have an adverse effect on the value, price or income return of the investment.
To the extent permitted by law, Phillip Securities Research, or persons associated with or connected to Phillip Securities Research, including but not limited to its officers, directors, employees or persons involved in the issuance of this report, may at any time engage in any of the above activities as set out above or otherwise hold an interest, whether material or not, in respect of companies and investments or related investments, which may be mentioned in this report. Accordingly, information may be available to Phillip Securities Research, or persons associated with or connected to Phillip Securities Research, including but not limited to its officers, directors, employees or persons involved in the issuance of this report, which is not reflected in this report, and Phillip Securities Research, or persons associated with or connected to Phillip Securities Research, including but not limited to its officers, directors, employees or persons involved in the issuance of this report, may, to the extent permitted by law, have acted upon or used the information prior to or immediately following its publication. Phillip Securities Research, or persons associated with or connected to Phillip Securities Research, including but not limited its officers, directors, employees or persons involved in the issuance of this report, may have issued other material that is inconsistent with, or reach different conclusions from, the contents of this report.
The information, tools and material presented herein are not directed, intended for distribution to or use by, any person or entity in any jurisdiction or country where such distribution, publication, availability or use would be contrary to the applicable law or regulation or which would subject Phillip Securities Research to any registration or licensing or other requirement, or penalty for contravention of such requirements within such jurisdiction.
This report is intended for general circulation only and does not take into account the specific investment objectives, financial situation or particular needs of any particular person. The products mentioned in this report may not be suitable for all investors and a person receiving or reading this report should seek advice from a professional and financial adviser regarding the legal, business, financial, tax and other aspects including the suitability of such products, taking into account the specific investment objectives, financial situation or particular needs of that person, before making a commitment to invest in any of such products.
This report is not intended for distribution, publication to or use by any person in any jurisdiction outside of Singapore or any other jurisdiction as Phillip Securities Research may determine in its absolute discretion.
IMPORTANT DISCLOSURES FOR INCLUDED RESEARCH ANALYSES OR REPORTS OF FOREIGN RESEARCH HOUSE
Where the report contains research analyses or reports from a foreign research house, please note:

Jeremy specialises in Technical Analysis and has 10 years of experience in studying price action. His areas of expertise include intermarket analysis on the equities, currencies, commodities and bonds market.
He is also a regular columnist on The Business Times - every Monday ChartPoint column.
He graduated with a Bachelor of Science in Banking and Finance from University of London.
