
Tradable instruments:
ETF:
ProShares S&P 500 Dividend Aristocrats ETF – (AMEX:NOBL)
The ProShares S&P 500 Dividend Aristocrats ETF tracks an equal-weighted index of 50 S&P 500 constituents that have increased dividend payments annually for at least 25 years.
*NOBL was incepted in 2013
In our recent report on the S&P 500, we believe the current economic expansionary cycle is in its late stage. Multiple indicators have yet to indicate an imminent correction, hence we believe that while investors can continue to be invested in equity markets, more caution is advised going forward.
Additionally, with several factors like the escalating tensions in North Korea and their successful nuclear tests and the coming debt-ceiling deadline, it would prudent for investors to start taking more defensive posture as valuations scale higher and to hedge their positions against any significant market correction.
For investors that want equity exposure that provides income and lower volatility, we believe that the ProShares S&P 500 Dividend Aristocrats ETF (NOBL) might prove useful as a defensive component in their portfolios.
Investment Action
NOBL tracks a list of constituents that have increased their dividend payouts for 25 consecutive years or more. In the last two major market crises, 1) NOBL fell significantly less than the S&P 500 index; 2) recovered faster than the S&P index and 3) continued paying out ever increasing dividends, which allowed investors to weather through crisis periods. As such we believe that NOBL would perform well as a defensive tool for investors.
Figure 1: Performance during Crises periods
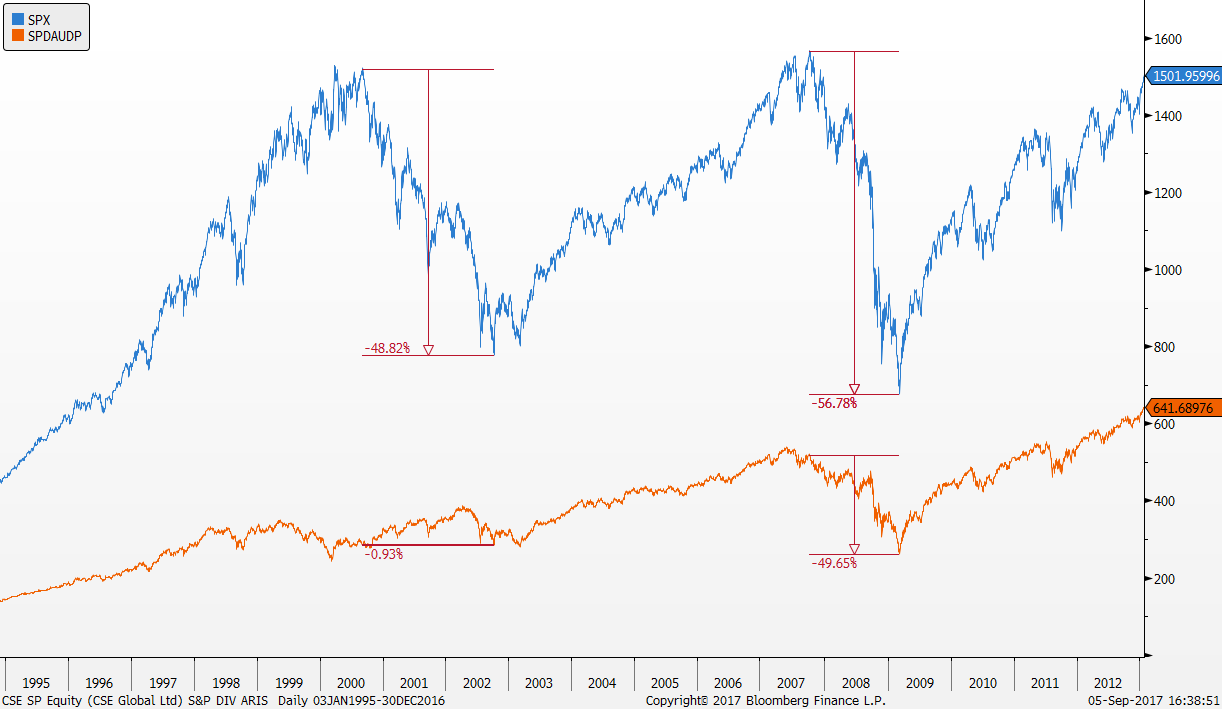
Source: PSR, Bloomberg
Limited Downside during crises
As can be seen in Figure 1, during the past two major crises, the Dot-com bubble and the Global Financial Crisis (GFC), NOBL (or SPDAUD in the chart) had significantly less downside than the SPX index. During the GFC, the NOBL fell by almost 7% points less than the S&P 500 index, 49.65% vs 56.78%.
The defensive nature of NOBL was even more pronounced during the Dot-com bubble. When the index fell almost 50%, NOBL fell by barely 1%. This was due to a dearth in Technology stocks in the NOBL list. This crisis might be a closer analogy to our current time period than the GFC, seeing as the NASDAQ has been running hot in recent years.
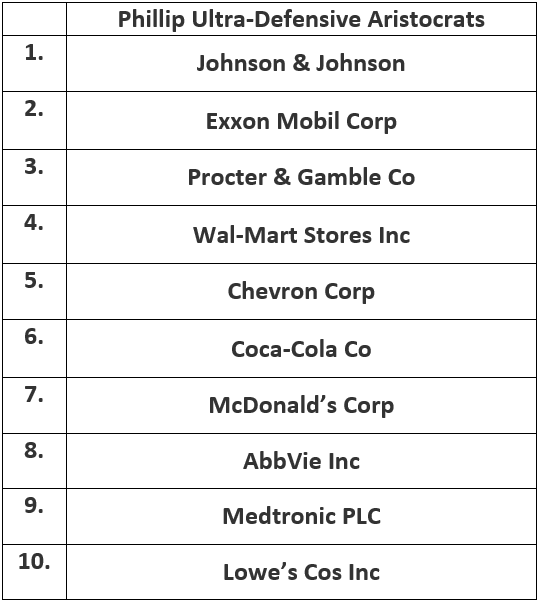
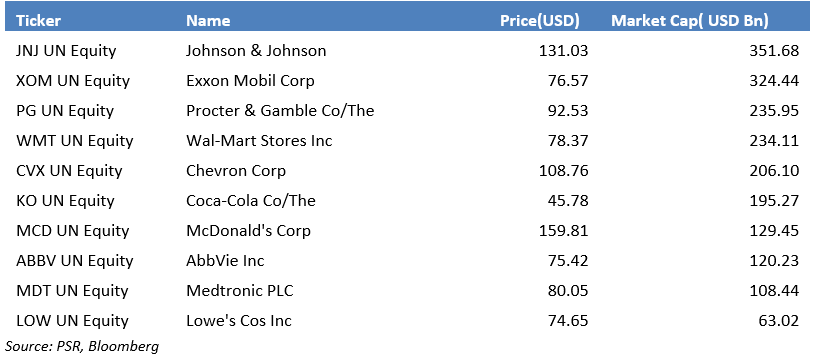
For investors looking to be even more defensive, we have constructed a sample portfolio chosen from the more defensive sectors within the NOBL: Healthcare, Consumer Staples and Discretionary and Energy.
Figure 2: Performance of Phillip Ultra-Defensive Aristocrats during recent crises
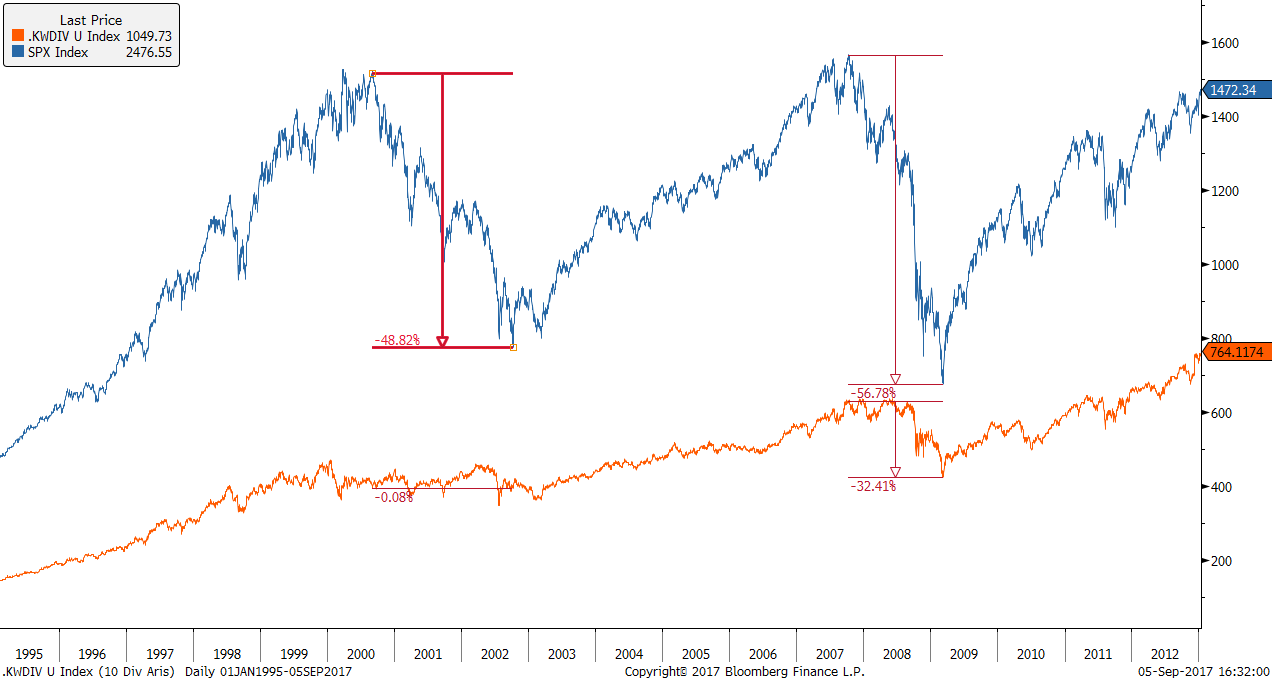
Source: PSR, Bloomberg
Figure 3: Phillip Ultra-Defensive Aristocrats for even lower volatility
As can be seen, during the Dot-com bubble, our modified defensive portfolio barely fell, outperforming even the NOBL. The defensive portfolio also significantly outperformed during the GFC, falling more than 24% less than the index.
Faster recovery on the upside
Next, not only did the NOBL show less downside during the previous two crises, they also registered a faster recovery post crisis. When comparing the annual returns for the 4 years following bottom of each crisis, we can see that on average, the NOBL outperformed the index.
Figure 4: Comparative Returns (Post Dot-Com)
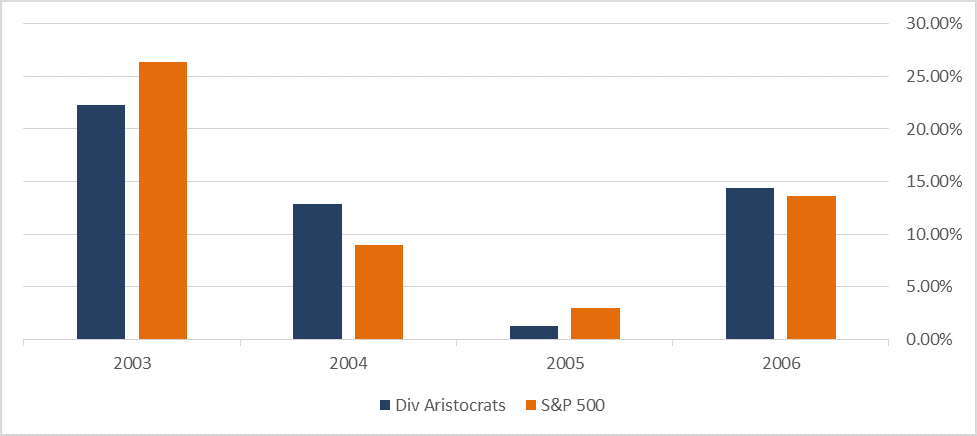
Figure 5: Comparative Total Returns (Post Dot-Com)
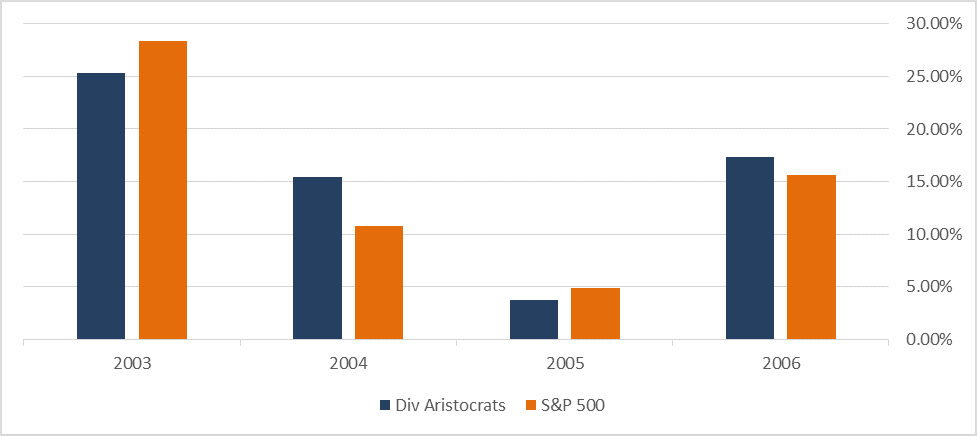
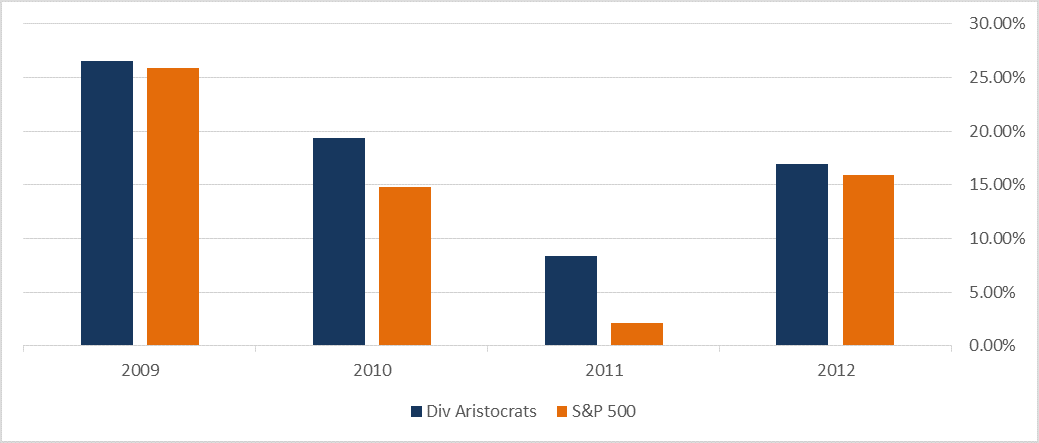
Figure 6: Comparative Returns (Post GFC)
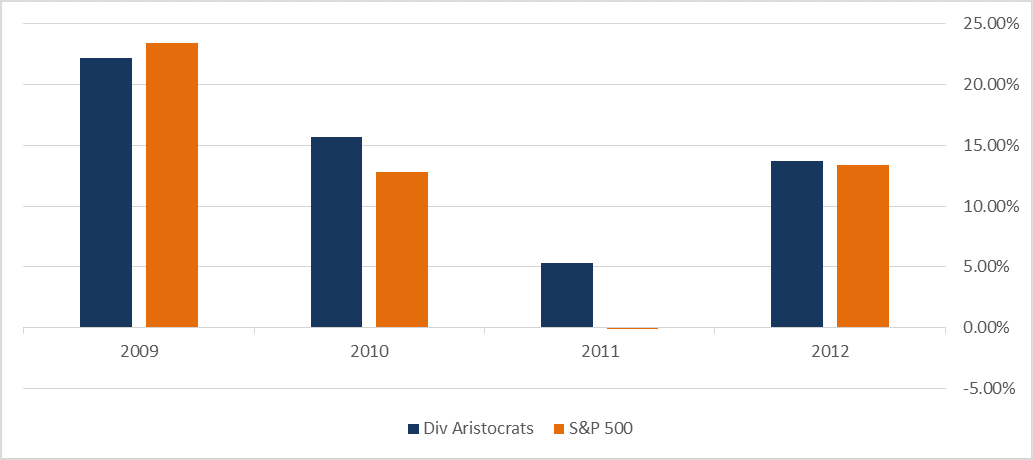
Figure 7. Comparative Total Returns (Post GFC)
Source: PSR, Bloomberg
In Figure 4, we see that in the 4 years post Dot-com bubble, the NOBL beat the index in 2 of those years. When dividends for both NOBL and S&P 500 were included in Figure 5 for Total Return, the amount that the Aristocrats beat the index is greater and the underperformance in years they did not beat was lessened. When taking into account NOBL barely fell (<1%) during the crash, its relative performance is even more impressive.
In the 4 years post-GFC, we see that the NOBL outperformed the index in 3 of those years. When dividends were taken into account in Figure 7, we can see that the NOBL beat the index for all 4 years post-GFC. Given that the criteria for inclusion in the NOBL list is increasing dividend payments for 25 consecutive years, it is not surprising that when dividends are included for both NOBL and S&P 500 index, the difference in returns is widened further.
Continuously growing dividends
Lastly, the NOBL, with its focus on dividends, gives investors holding power to weather downturns in the market. With the criteria of increasing dividends every consecutive year for 25 years, at a minimum, the stocks in the Aristocrat list have been growing their dividends every single year since 1992.
Since 1992 to today, the constituents that NOBL tracks have not only paid out a dividend through the Asian Financial crisis (1997), the Dot-Com bubble (2000), the September 11 attack (2001), the Global Financial Crisis (2007-2008) and the European sovereign debt crisis (2010), but they have all increased their dividends every single year as well.
Figure 8: Financial crisis timeline
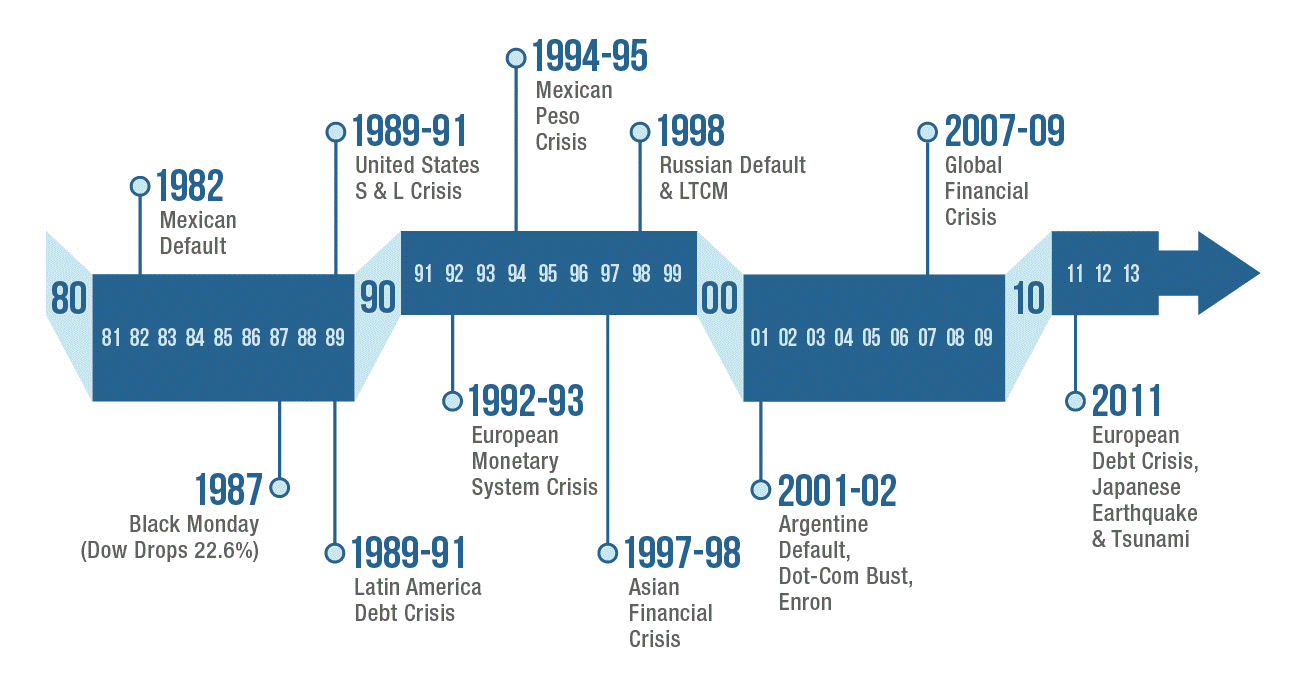
Source: Sidecar Capital
Figure 9: 5 yr Div CAGR & Div Growth History
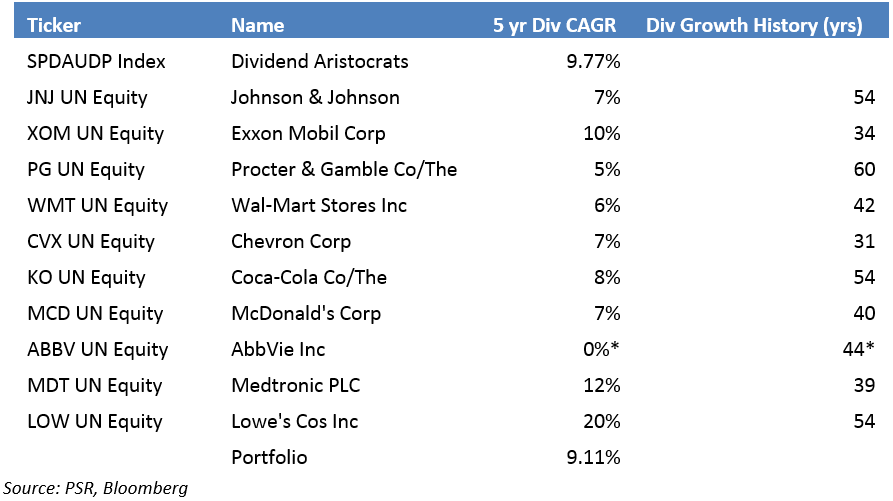
* AbbVie Inc was spun off from Abbott Laboratories in 2013, its 3yr Div growth rate is 12.50%
From Figure 9, the average 5 year dividend CAGR of the constituents tracked by NOBL is about 9.77%. As the ETF equal weights the constituents of the Dividend Aristocrats, the average 5 year dividend CAGR was taken to get an idea of the dividend growth rate investors might possibly expect from investing in the NOBL.
For our Phillip Ultra-Defensive portfolio, the average 5 year dividend CAGR came up to 9.11%, however, that includes a 0% from ABBV, which was spun off from Abbott Laboratories in 2013. Its 3 year dividend CAGR was 12.50%, hence the expected dividend growth rate for the portfolio should be higher than the 9.11% and likely higher than the 9.77% average of the entire Aristocrats list.
Additionally, while the minimum requirement of the NOBL is 25 years consecutive dividend increases, the shortest dividend growth streak for the components of the defensive portfolio comes up to 31 years, with the longest being 60 years. Of course, there are no guarantees that the constituents will be able to sustain their dividend growth streaks and investors should still be aware of risk going forward. However, given that the constituents of NOBL, and by extension the portfolio, have been able to not only pay out a dividend through multiple financial crises but also continue to increase that dividend through those crises, we are fairly certain that they would be able to maintain their dividend growth streaks. As such, we believe that with the growing dividends, investors will be able to better weather downturns in the market as they are paid while waiting for recovery to come.
Conclusion: As current market conditions have yet to signal an imminent correction, investors might wish to remain invested in the equity market and yet be defensive given current market valuations and with several uncertainties in geo-political landscape. Hence, we believe that investors might benefit from shifting their assets to the ProShares S&P 500 Dividend Aristocrats ETF (AMEX:NOBL). Due to its 1) limited downside during the past two major crises, 2) faster recovery than the index in first few years following the crises and 3) continually increasing dividends that allow investors to weather through crisis periods, we believe that this would help perform a defensive function in investors’ portfolios.
Important Information
This report is prepared and/or distributed by Phillip Securities Research Pte Ltd ("Phillip Securities Research"), which is a holder of a financial adviser’s licence under the Financial Advisers Act, Chapter 110 in Singapore.
By receiving or reading this report, you agree to be bound by the terms and limitations set out below. Any failure to comply with these terms and limitations may constitute a violation of law. This report has been provided to you for personal use only and shall not be reproduced, distributed or published by you in whole or in part, for any purpose. If you have received this report by mistake, please delete or destroy it, and notify the sender immediately.
The information and any analysis, forecasts, projections, expectations and opinions (collectively, the “Research”) contained in this report has been obtained from public sources which Phillip Securities Research believes to be reliable. However, Phillip Securities Research does not make any representation or warranty, express or implied that such information or Research is accurate, complete or appropriate or should be relied upon as such. Any such information or Research contained in this report is subject to change, and Phillip Securities Research shall not have any responsibility to maintain or update the information or Research made available or to supply any corrections, updates or releases in connection therewith.
Any opinions, forecasts, assumptions, estimates, valuations and prices contained in this report are as of the date indicated and are subject to change at any time without prior notice. Past performance of any product referred to in this report is not indicative of future results.
This report does not constitute, and should not be used as a substitute for, tax, legal or investment advice. This report should not be relied upon exclusively or as authoritative, without further being subject to the recipient’s own independent verification and exercise of judgment. The fact that this report has been made available constitutes neither a recommendation to enter into a particular transaction, nor a representation that any product described in this report is suitable or appropriate for the recipient. Recipients should be aware that many of the products, which may be described in this report involve significant risks and may not be suitable for all investors, and that any decision to enter into transactions involving such products should not be made, unless all such risks are understood and an independent determination has been made that such transactions would be appropriate. Any discussion of the risks contained herein with respect to any product should not be considered to be a disclosure of all risks or a complete discussion of such risks.
Nothing in this report shall be construed to be an offer or solicitation for the purchase or sale of any product. Any decision to purchase any product mentioned in this report should take into account existing public information, including any registered prospectus in respect of such product.
Phillip Securities Research, or persons associated with or connected to Phillip Securities Research, including but not limited to its officers, directors, employees or persons involved in the issuance of this report, may provide an array of financial services to a large number of corporations in Singapore and worldwide, including but not limited to commercial / investment banking activities (including sponsorship, financial advisory or underwriting activities), brokerage or securities trading activities. Phillip Securities Research, or persons associated with or connected to Phillip Securities Research, including but not limited to its officers, directors, employees or persons involved in the issuance of this report, may have participated in or invested in transactions with the issuer(s) of the securities mentioned in this report, and may have performed services for or solicited business from such issuers. Additionally, Phillip Securities Research, or persons associated with or connected to Phillip Securities Research, including but not limited to its officers, directors, employees or persons involved in the issuance of this report, may have provided advice or investment services to such companies and investments or related investments, as may be mentioned in this report.
Phillip Securities Research or persons associated with or connected to Phillip Securities Research, including but not limited to its officers, directors, employees or persons involved in the issuance of this report may, from time to time maintain a long or short position in securities referred to herein, or in related futures or options, purchase or sell, make a market in, or engage in any other transaction involving such securities, and earn brokerage or other compensation in respect of the foregoing. Investments will be denominated in various currencies including US dollars and Euro and thus will be subject to any fluctuation in exchange rates between US dollars and Euro or foreign currencies and the currency of your own jurisdiction. Such fluctuations may have an adverse effect on the value, price or income return of the investment.
To the extent permitted by law, Phillip Securities Research, or persons associated with or connected to Phillip Securities Research, including but not limited to its officers, directors, employees or persons involved in the issuance of this report, may at any time engage in any of the above activities as set out above or otherwise hold an interest, whether material or not, in respect of companies and investments or related investments, which may be mentioned in this report. Accordingly, information may be available to Phillip Securities Research, or persons associated with or connected to Phillip Securities Research, including but not limited to its officers, directors, employees or persons involved in the issuance of this report, which is not reflected in this report, and Phillip Securities Research, or persons associated with or connected to Phillip Securities Research, including but not limited to its officers, directors, employees or persons involved in the issuance of this report, may, to the extent permitted by law, have acted upon or used the information prior to or immediately following its publication. Phillip Securities Research, or persons associated with or connected to Phillip Securities Research, including but not limited its officers, directors, employees or persons involved in the issuance of this report, may have issued other material that is inconsistent with, or reach different conclusions from, the contents of this report.
The information, tools and material presented herein are not directed, intended for distribution to or use by, any person or entity in any jurisdiction or country where such distribution, publication, availability or use would be contrary to the applicable law or regulation or which would subject Phillip Securities Research to any registration or licensing or other requirement, or penalty for contravention of such requirements within such jurisdiction.
This report is intended for general circulation only and does not take into account the specific investment objectives, financial situation or particular needs of any particular person. The products mentioned in this report may not be suitable for all investors and a person receiving or reading this report should seek advice from a professional and financial adviser regarding the legal, business, financial, tax and other aspects including the suitability of such products, taking into account the specific investment objectives, financial situation or particular needs of that person, before making a commitment to invest in any of such products.
This report is not intended for distribution, publication to or use by any person in any jurisdiction outside of Singapore or any other jurisdiction as Phillip Securities Research may determine in its absolute discretion.
IMPORTANT DISCLOSURES FOR INCLUDED RESEARCH ANALYSES OR REPORTS OF FOREIGN RESEARCH HOUSE
Where the report contains research analyses or reports from a foreign research house, please note:

Ho Kang Wei graduated with a Bachelor of Commerce, majoring in Accounting and Finance, from Monash University.
He started analysing and investing in US equity markets since 2008. Joining Phillip Securities Research in 2015, he is the analyst in charge of US markets.
