
This article was published in Business Times’ column “Chart Point” on 13 November 2017.
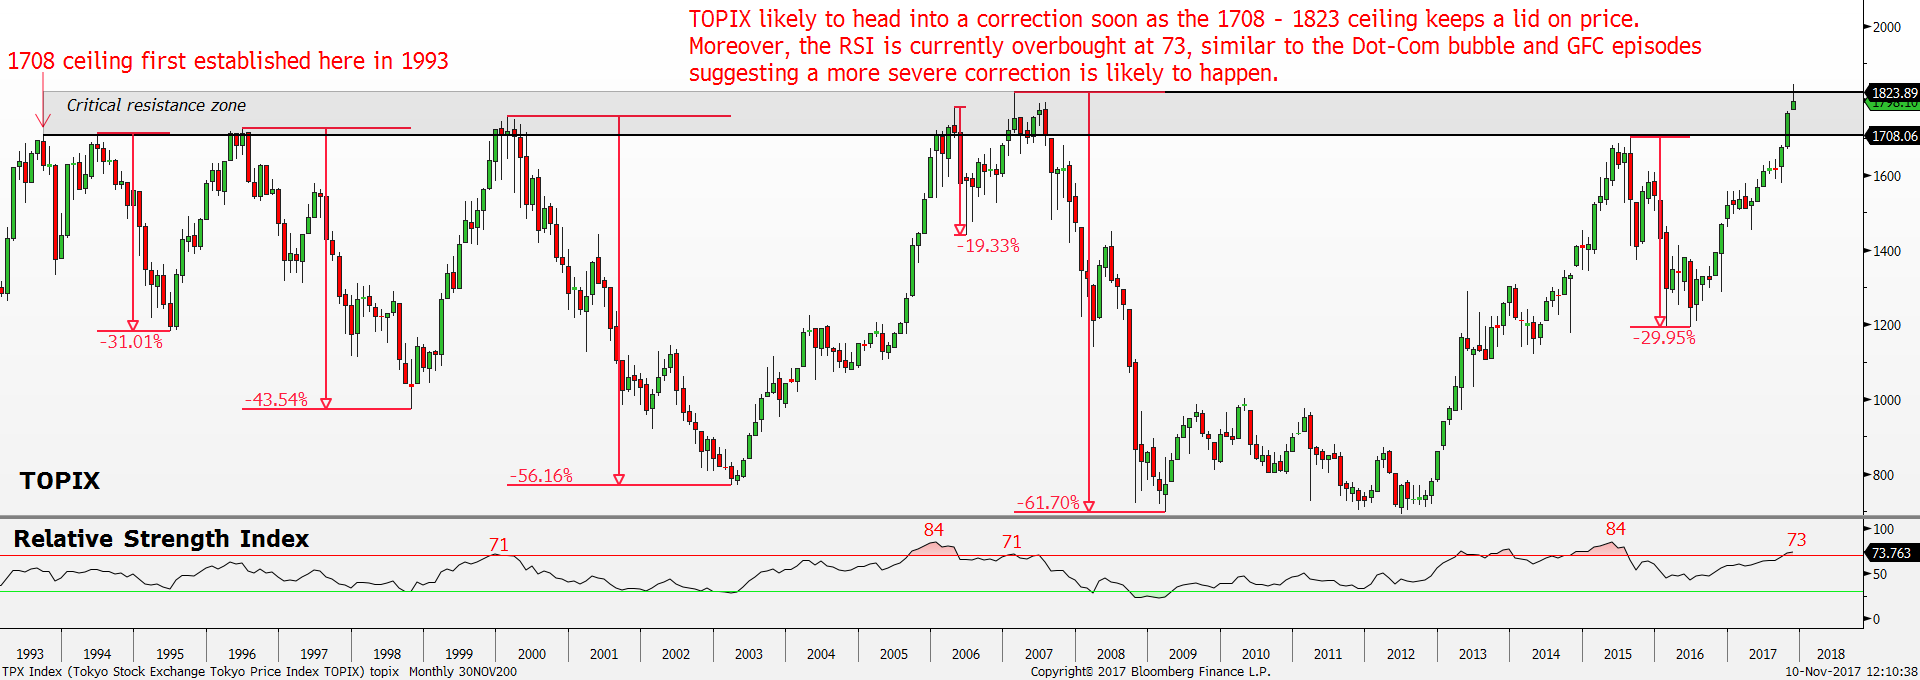
TOPIX Monthly chart Source: Bloomberg, PSR
Amid the soaring Japanese equity market, the long-term price pattern of the TOPIX reveals a major obstacle ahead. With the Bank of Japan being the last few central banks to have any plans to tighten monetary policy, the excess liquidity continues to drive the Japanese equity market higher, and the current bullish momentum appears unrelenting. Both the Nikkei 225 and Tokyo Stock Price Index (TOPIX) soared to a new 52-week high with the Nikkei 225 leading the way as it has already surpassed 23% above the 2007 high of 18,300 points while the TOPIX is only currently testing the 2007 high of 1823 points. TOPIX is a capitalization-weighted index of all firms listed on the first section of the Tokyo Stock Exchange.
The price action becomes more interesting as the TOPIX approaches its multi-decade top between 1708 to 1823 points. The 1708 point was first established in September 1993. Since then, it has been a stumbling block for the bulls. There were six prior attempts by the bulls to take price higher above the 1708 roof, but every single try was rejected aggressively shown by the down arrow. During the housing boom period of 2000, the TOPIX managed to break above the 1708 critical resistance in February 2007. However, the bullish momentum only lasted for five months before the Global Financial Crisis (GFC) top formed at 1823 points. As we edge higher from here on, the TOPIX will very likely face some rejection off the GFC high of 1823 points and enter into a period of correction. The unrelenting bullish momentum since August 2016 should take a breather soon.
Historically, the average correction that follows after the reversal at the 1708 ceiling is -39%, and the largest drawdown happened in the GFC where the TOPIX crumbled -61% from the 1823 peak to 698 trough. Adding another layer to the analysis by looking at the Relative Strength Index (RSI) also suggests a high likelihood of a correction soon. RSI measures momentum to identify overbought or oversold condition. Reading above 70 represents overbought condition while reading below 30 represents oversold condition.
Out of the six occasions where the market correction happened around the 1708 resistance area, four occurred with an overbought RSI above 70. To make matters worse, the more severe corrections happened when the RSI was overbought. The Dot-com bubble era in the late 1990s took the RSI to a high of 71 in December 1999. Four months later, the Dot-com high was formed as the 1708 ceiling kept a lid on price which then resulted in a -56% drawdown over the next three years. The GFC high also occurred with an overbought RSI as the 1708 ceiling weigh down on price. A similar high of 71 on the RSI was formed in February 2007 where the TOPIX took five months to top out. The GFC led a crash of -61% in the TOPIX.
Fast forward to present, the recent bullish surge has once again brought the TOPIX back to the critical resistance area between the 1708 – 1823 points. Moreover, the move higher has also pushed the RSI into overbought condition to 73. History does not repeat but often rhymes. As the TOPIX edges closer to the upper range of 1823 point of interest with the overbought RSI, there is a high likelihood of a correction around the corner. Watch this area closely to see if the 1708 – 1823 ceiling holds up or not where a correction of up to -20% is possible.
Important Information
This report is prepared and/or distributed by Phillip Securities Research Pte Ltd ("Phillip Securities Research"), which is a holder of a financial adviser’s licence under the Financial Advisers Act, Chapter 110 in Singapore.
By receiving or reading this report, you agree to be bound by the terms and limitations set out below. Any failure to comply with these terms and limitations may constitute a violation of law. This report has been provided to you for personal use only and shall not be reproduced, distributed or published by you in whole or in part, for any purpose. If you have received this report by mistake, please delete or destroy it, and notify the sender immediately.
The information and any analysis, forecasts, projections, expectations and opinions (collectively, the “Research”) contained in this report has been obtained from public sources which Phillip Securities Research believes to be reliable. However, Phillip Securities Research does not make any representation or warranty, express or implied that such information or Research is accurate, complete or appropriate or should be relied upon as such. Any such information or Research contained in this report is subject to change, and Phillip Securities Research shall not have any responsibility to maintain or update the information or Research made available or to supply any corrections, updates or releases in connection therewith.
Any opinions, forecasts, assumptions, estimates, valuations and prices contained in this report are as of the date indicated and are subject to change at any time without prior notice. Past performance of any product referred to in this report is not indicative of future results.
This report does not constitute, and should not be used as a substitute for, tax, legal or investment advice. This report should not be relied upon exclusively or as authoritative, without further being subject to the recipient’s own independent verification and exercise of judgment. The fact that this report has been made available constitutes neither a recommendation to enter into a particular transaction, nor a representation that any product described in this report is suitable or appropriate for the recipient. Recipients should be aware that many of the products, which may be described in this report involve significant risks and may not be suitable for all investors, and that any decision to enter into transactions involving such products should not be made, unless all such risks are understood and an independent determination has been made that such transactions would be appropriate. Any discussion of the risks contained herein with respect to any product should not be considered to be a disclosure of all risks or a complete discussion of such risks.
Nothing in this report shall be construed to be an offer or solicitation for the purchase or sale of any product. Any decision to purchase any product mentioned in this report should take into account existing public information, including any registered prospectus in respect of such product.
Phillip Securities Research, or persons associated with or connected to Phillip Securities Research, including but not limited to its officers, directors, employees or persons involved in the issuance of this report, may provide an array of financial services to a large number of corporations in Singapore and worldwide, including but not limited to commercial / investment banking activities (including sponsorship, financial advisory or underwriting activities), brokerage or securities trading activities. Phillip Securities Research, or persons associated with or connected to Phillip Securities Research, including but not limited to its officers, directors, employees or persons involved in the issuance of this report, may have participated in or invested in transactions with the issuer(s) of the securities mentioned in this report, and may have performed services for or solicited business from such issuers. Additionally, Phillip Securities Research, or persons associated with or connected to Phillip Securities Research, including but not limited to its officers, directors, employees or persons involved in the issuance of this report, may have provided advice or investment services to such companies and investments or related investments, as may be mentioned in this report.
Phillip Securities Research or persons associated with or connected to Phillip Securities Research, including but not limited to its officers, directors, employees or persons involved in the issuance of this report may, from time to time maintain a long or short position in securities referred to herein, or in related futures or options, purchase or sell, make a market in, or engage in any other transaction involving such securities, and earn brokerage or other compensation in respect of the foregoing. Investments will be denominated in various currencies including US dollars and Euro and thus will be subject to any fluctuation in exchange rates between US dollars and Euro or foreign currencies and the currency of your own jurisdiction. Such fluctuations may have an adverse effect on the value, price or income return of the investment.
To the extent permitted by law, Phillip Securities Research, or persons associated with or connected to Phillip Securities Research, including but not limited to its officers, directors, employees or persons involved in the issuance of this report, may at any time engage in any of the above activities as set out above or otherwise hold an interest, whether material or not, in respect of companies and investments or related investments, which may be mentioned in this report. Accordingly, information may be available to Phillip Securities Research, or persons associated with or connected to Phillip Securities Research, including but not limited to its officers, directors, employees or persons involved in the issuance of this report, which is not reflected in this report, and Phillip Securities Research, or persons associated with or connected to Phillip Securities Research, including but not limited to its officers, directors, employees or persons involved in the issuance of this report, may, to the extent permitted by law, have acted upon or used the information prior to or immediately following its publication. Phillip Securities Research, or persons associated with or connected to Phillip Securities Research, including but not limited its officers, directors, employees or persons involved in the issuance of this report, may have issued other material that is inconsistent with, or reach different conclusions from, the contents of this report.
The information, tools and material presented herein are not directed, intended for distribution to or use by, any person or entity in any jurisdiction or country where such distribution, publication, availability or use would be contrary to the applicable law or regulation or which would subject Phillip Securities Research to any registration or licensing or other requirement, or penalty for contravention of such requirements within such jurisdiction.
This report is intended for general circulation only and does not take into account the specific investment objectives, financial situation or particular needs of any particular person. The products mentioned in this report may not be suitable for all investors and a person receiving or reading this report should seek advice from a professional and financial adviser regarding the legal, business, financial, tax and other aspects including the suitability of such products, taking into account the specific investment objectives, financial situation or particular needs of that person, before making a commitment to invest in any of such products.
This report is not intended for distribution, publication to or use by any person in any jurisdiction outside of Singapore or any other jurisdiction as Phillip Securities Research may determine in its absolute discretion.
IMPORTANT DISCLOSURES FOR INCLUDED RESEARCH ANALYSES OR REPORTS OF FOREIGN RESEARCH HOUSE
Where the report contains research analyses or reports from a foreign research house, please note:

Jeremy specialises in Technical Analysis and has 10 years of experience in studying price action. His areas of expertise include intermarket analysis on the equities, currencies, commodities and bonds market.
He is also a regular columnist on The Business Times - every Monday ChartPoint column.
He graduated with a Bachelor of Science in Banking and Finance from University of London.
