
Tradable Instruments:
PowerShares DB US Dollar Index Bear – (AMEX:UDN)
The UDN is an exchange traded fund that tracks the changes in value of Euro, Japanese Yen, Canadian Dollar, Swedish Krona and Swiss France relative to the US Dollar. It shorts the USDX contracts, essentially shorting the US Dollar and long the Euro, Japanese Yen, Canadian Dollar, Swedish Krona and Swiss France.
SPDR GLD US$ – (SGX:O87)
SPDR Gold Trust – (AMEX:GLD)
SPDR Gold Shares (GLD) is an exchange-traded fund (ETF) that offers investors an innovative, relatively cost efficient and secure way to access the gold market. SPDR Gold Shares are intended to offer investors a means of participating in the gold bullion market without the necessity of taking physical delivery of gold, and to buy and sell that interest through the trading of security on a regulated stock exchange.
GLDUSD (Phillip Futures)
Ishares Silver Trust – (AMEX:SLV)
The Ishares Silver Trust (SLV) is an exchange-traded fund (ETF) that seeks to reflect generally the performance of the price of silver
SLVUSD (Phillip Futures)
98 Month cyclical top
Since the 1970s, the DXY has been following a 98-month cycle or approximately 8 year where it forms a cyclical top at the end of the 98th month. Each cyclical top is then followed by massive selloff resulting in the DXY collapsing back to the previous low from the prior downtrend. The selloffs ranged from 12% to 42% over the last four cycle.
Figure 1. 98-month cyclical top is formed, calling a 30% downside in DXY
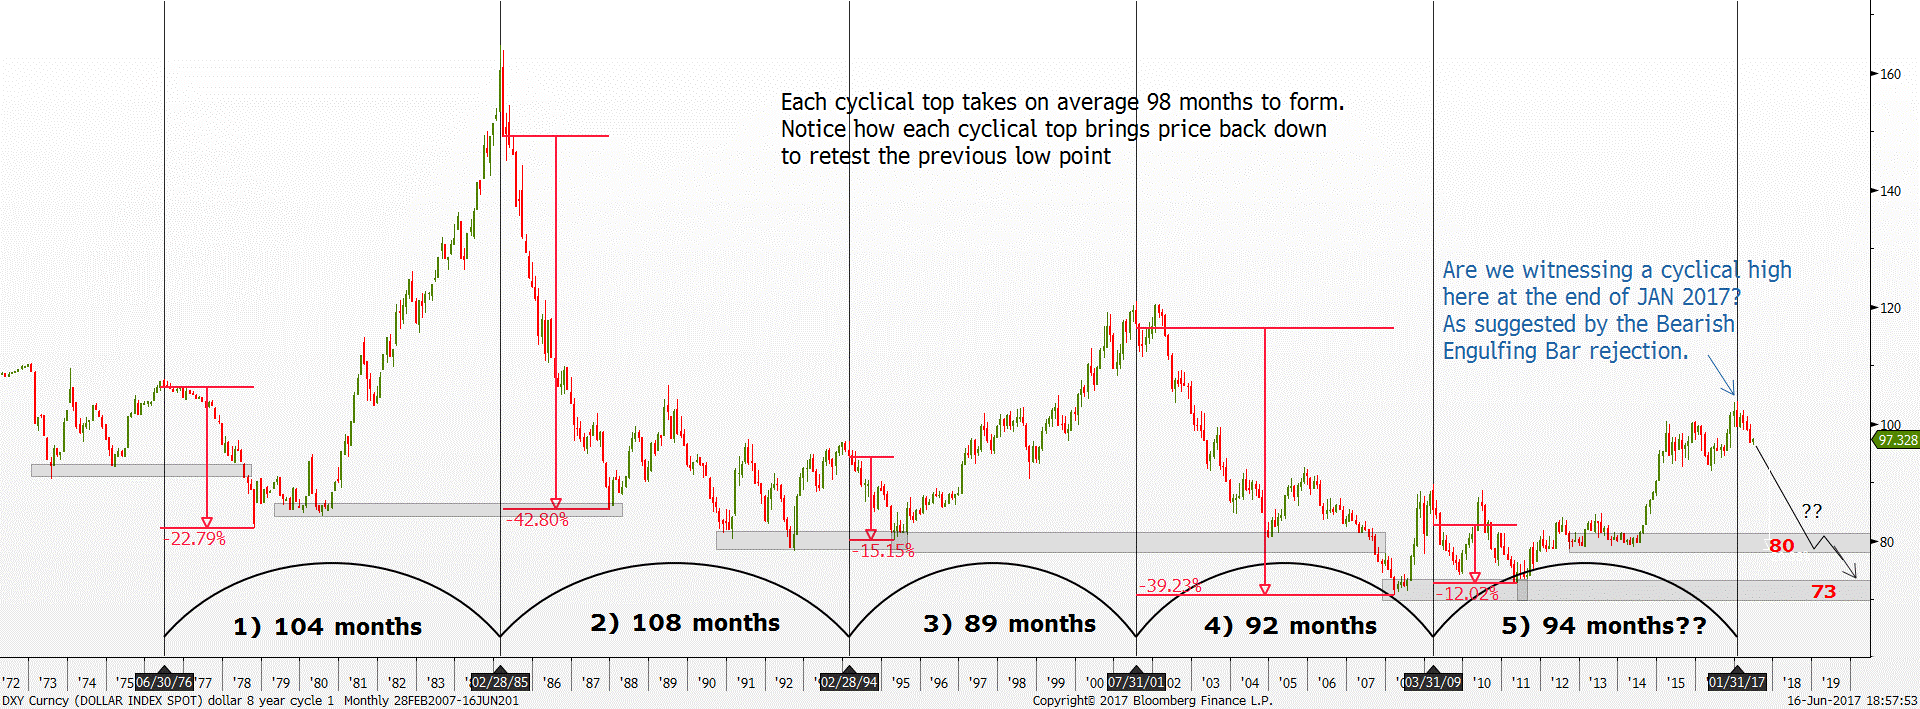
Source: Bloomberg
In total, there were four instances where the DXY traded around 98-month cycle:
Notice how every cyclical top results in a selloff that is in the order of magnitude that retests its prior respective lows and each cyclical top is being signaled by bearish price action such as Bearish Engulfing/Outside Bar or Shooting star.
If we were to use the April 2009 cyclical top as the reference point for the current cycle calculation, using the 98-month average will bring us to May 2017. In other words, the range around May 2017 will be the timeframe to look out for the next cyclical top within the DXY. Keep in mind the 98-month cycle is a rough estimation of where to locate the cyclical top.
With the benefit of hindsight, the strong Bearish Outside bar rejection off the 103.50 resistance recently in January 2017 is pointing out that a new cyclical top has been formed. That also suggest the current cyclical top took 94 months to finalize which is well in range of the cyclical top formation of 89 months to 108 months. If history were to repeat, there is a high chance that the DXY will move into a forceful downtrend next to retest the previous decade low of 73 – 72. That move will translate into a -30% loss.
Near term target for the DXY will be around the 92.61 range low.
Long Term Fibonacci Retracement Level
To better pinpoint the exact timing of the cyclical top, we did a thorough price action study and the conclusion was that the DXY is still stuck in a depressed long term downtrend. We noticed the DXY tends to react to critical Fibonacci Retracement Level that was originated from prior long term downtrend.
Figure 2. 61.8% critical Fibonacci Retracement Level currently resisting price
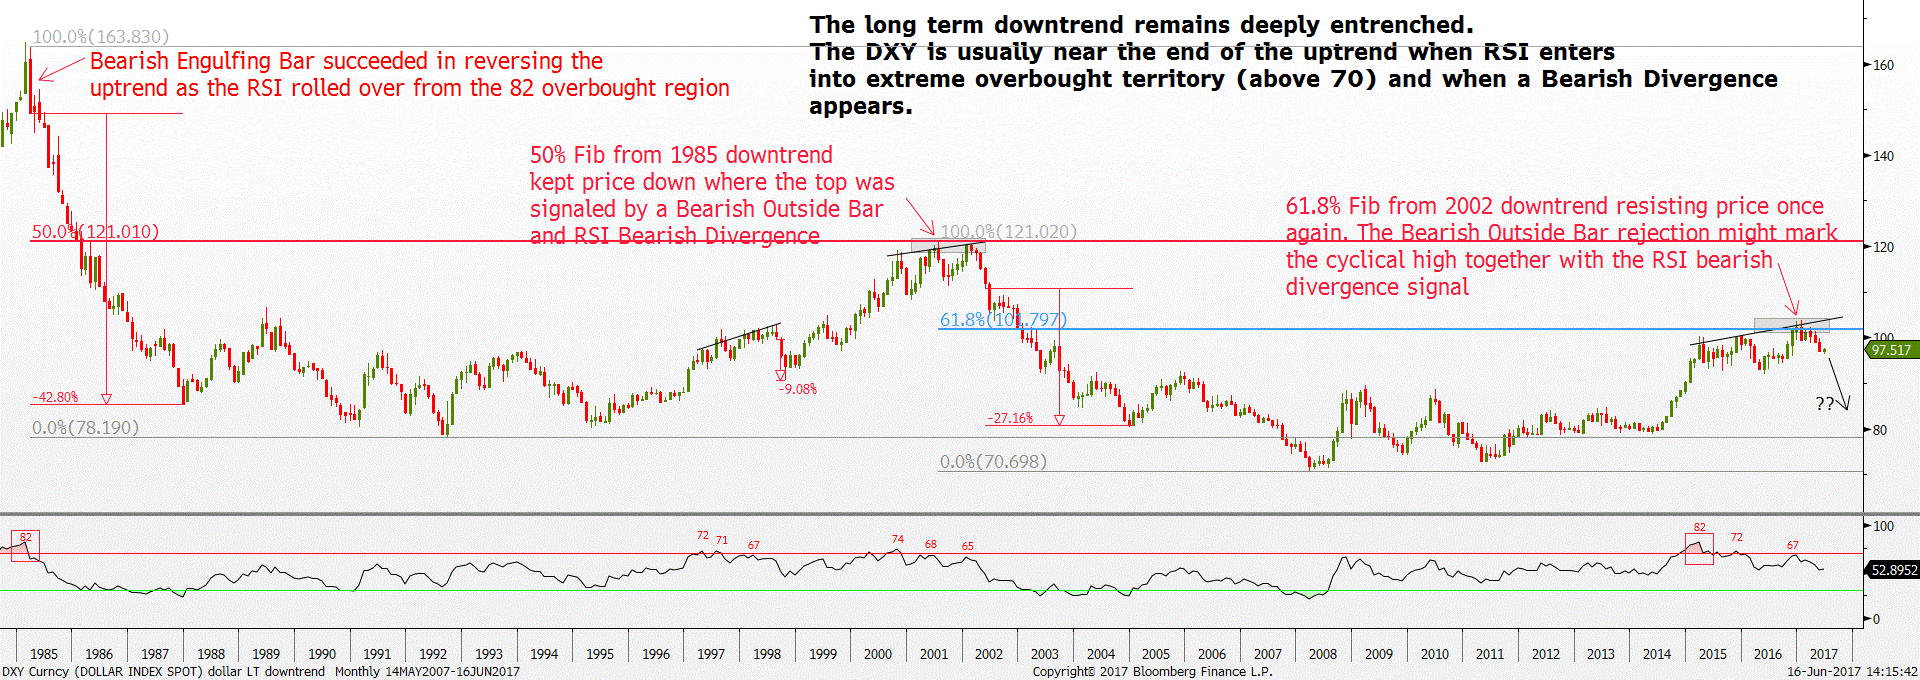
Source: Bloomberg
During the recovery phase in 1995 – 2001, the DXY was moving in a stable uptrend. However, as it neared the 50% Fibonacci Retracement level (121) that was established in the downtrend since 1985, the DXY eventually reversed and turn into a downtrend in July 2001. Moreover, this bearish rejection off the 50% Fibonacci Retracement level happened in line with the 90-month cycle and was signaled by a Bearish Outside Bar and RSI Bearish Divergence as well.
Fast forward to current times, the DXY made another strong recovery since 2011 but the bullish momentum appears ready to reverse. The DXY once again reacted violently to the 61.8% Fibonacci Retracement level from the 2002 downtrend resulted in the formation of a Bearish Outside Bar rejection in January 2017. Furthermore, the current bearish rejection was in conjunction with the new 98-month cyclical top and RSI Bearish Divergence. The DXY has also closed back below the 100 psychological round number which successfully turned the sentiment back into the bearish camp.
Notice how similar the current cyclical top is to the one in July 2001. Both cyclical top were signaled by Bearish Outside Bar rejection off the respective critical Fibonacci Retracement level. In addition, the bearish rejection was also signaled by a broader bearish formation, heads and shoulder pattern/triple top pattern with RSI Bearish Divergence.
Please login to download the full report in PDF.
Important Information
This report is prepared and/or distributed by Phillip Securities Research Pte Ltd ("Phillip Securities Research"), which is a holder of a financial adviser’s licence under the Financial Advisers Act, Chapter 110 in Singapore.
By receiving or reading this report, you agree to be bound by the terms and limitations set out below. Any failure to comply with these terms and limitations may constitute a violation of law. This report has been provided to you for personal use only and shall not be reproduced, distributed or published by you in whole or in part, for any purpose. If you have received this report by mistake, please delete or destroy it, and notify the sender immediately.
The information and any analysis, forecasts, projections, expectations and opinions (collectively, the “Research”) contained in this report has been obtained from public sources which Phillip Securities Research believes to be reliable. However, Phillip Securities Research does not make any representation or warranty, express or implied that such information or Research is accurate, complete or appropriate or should be relied upon as such. Any such information or Research contained in this report is subject to change, and Phillip Securities Research shall not have any responsibility to maintain or update the information or Research made available or to supply any corrections, updates or releases in connection therewith.
Any opinions, forecasts, assumptions, estimates, valuations and prices contained in this report are as of the date indicated and are subject to change at any time without prior notice. Past performance of any product referred to in this report is not indicative of future results.
This report does not constitute, and should not be used as a substitute for, tax, legal or investment advice. This report should not be relied upon exclusively or as authoritative, without further being subject to the recipient’s own independent verification and exercise of judgment. The fact that this report has been made available constitutes neither a recommendation to enter into a particular transaction, nor a representation that any product described in this report is suitable or appropriate for the recipient. Recipients should be aware that many of the products, which may be described in this report involve significant risks and may not be suitable for all investors, and that any decision to enter into transactions involving such products should not be made, unless all such risks are understood and an independent determination has been made that such transactions would be appropriate. Any discussion of the risks contained herein with respect to any product should not be considered to be a disclosure of all risks or a complete discussion of such risks.
Nothing in this report shall be construed to be an offer or solicitation for the purchase or sale of any product. Any decision to purchase any product mentioned in this report should take into account existing public information, including any registered prospectus in respect of such product.
Phillip Securities Research, or persons associated with or connected to Phillip Securities Research, including but not limited to its officers, directors, employees or persons involved in the issuance of this report, may provide an array of financial services to a large number of corporations in Singapore and worldwide, including but not limited to commercial / investment banking activities (including sponsorship, financial advisory or underwriting activities), brokerage or securities trading activities. Phillip Securities Research, or persons associated with or connected to Phillip Securities Research, including but not limited to its officers, directors, employees or persons involved in the issuance of this report, may have participated in or invested in transactions with the issuer(s) of the securities mentioned in this report, and may have performed services for or solicited business from such issuers. Additionally, Phillip Securities Research, or persons associated with or connected to Phillip Securities Research, including but not limited to its officers, directors, employees or persons involved in the issuance of this report, may have provided advice or investment services to such companies and investments or related investments, as may be mentioned in this report.
Phillip Securities Research or persons associated with or connected to Phillip Securities Research, including but not limited to its officers, directors, employees or persons involved in the issuance of this report may, from time to time maintain a long or short position in securities referred to herein, or in related futures or options, purchase or sell, make a market in, or engage in any other transaction involving such securities, and earn brokerage or other compensation in respect of the foregoing. Investments will be denominated in various currencies including US dollars and Euro and thus will be subject to any fluctuation in exchange rates between US dollars and Euro or foreign currencies and the currency of your own jurisdiction. Such fluctuations may have an adverse effect on the value, price or income return of the investment.
To the extent permitted by law, Phillip Securities Research, or persons associated with or connected to Phillip Securities Research, including but not limited to its officers, directors, employees or persons involved in the issuance of this report, may at any time engage in any of the above activities as set out above or otherwise hold an interest, whether material or not, in respect of companies and investments or related investments, which may be mentioned in this report. Accordingly, information may be available to Phillip Securities Research, or persons associated with or connected to Phillip Securities Research, including but not limited to its officers, directors, employees or persons involved in the issuance of this report, which is not reflected in this report, and Phillip Securities Research, or persons associated with or connected to Phillip Securities Research, including but not limited to its officers, directors, employees or persons involved in the issuance of this report, may, to the extent permitted by law, have acted upon or used the information prior to or immediately following its publication. Phillip Securities Research, or persons associated with or connected to Phillip Securities Research, including but not limited its officers, directors, employees or persons involved in the issuance of this report, may have issued other material that is inconsistent with, or reach different conclusions from, the contents of this report.
The information, tools and material presented herein are not directed, intended for distribution to or use by, any person or entity in any jurisdiction or country where such distribution, publication, availability or use would be contrary to the applicable law or regulation or which would subject Phillip Securities Research to any registration or licensing or other requirement, or penalty for contravention of such requirements within such jurisdiction.
This report is intended for general circulation only and does not take into account the specific investment objectives, financial situation or particular needs of any particular person. The products mentioned in this report may not be suitable for all investors and a person receiving or reading this report should seek advice from a professional and financial adviser regarding the legal, business, financial, tax and other aspects including the suitability of such products, taking into account the specific investment objectives, financial situation or particular needs of that person, before making a commitment to invest in any of such products.
This report is not intended for distribution, publication to or use by any person in any jurisdiction outside of Singapore or any other jurisdiction as Phillip Securities Research may determine in its absolute discretion.
IMPORTANT DISCLOSURES FOR INCLUDED RESEARCH ANALYSES OR REPORTS OF FOREIGN RESEARCH HOUSE
Where the report contains research analyses or reports from a foreign research house, please note:

Jeremy specialises in Technical Analysis and has 10 years of experience in studying price action. His areas of expertise include intermarket analysis on the equities, currencies, commodities and bonds market.
He is also a regular columnist on The Business Times - every Monday ChartPoint column.
He graduated with a Bachelor of Science in Banking and Finance from University of London.
