Post-United States election day, the US equity market reacted exuberantly on expectations of a large fiscal stimulus program, business deregulation and broad base tax cut under President-Elect Trump administration. The S&P 500 index rose 6% since 8 November 2016 Election Day while the Midcap 400 Index and Russell 2000 Index rallied 11.2% and 14.7% respectively.
Chart 1. Equity performance post-election day as of 6 January 2017
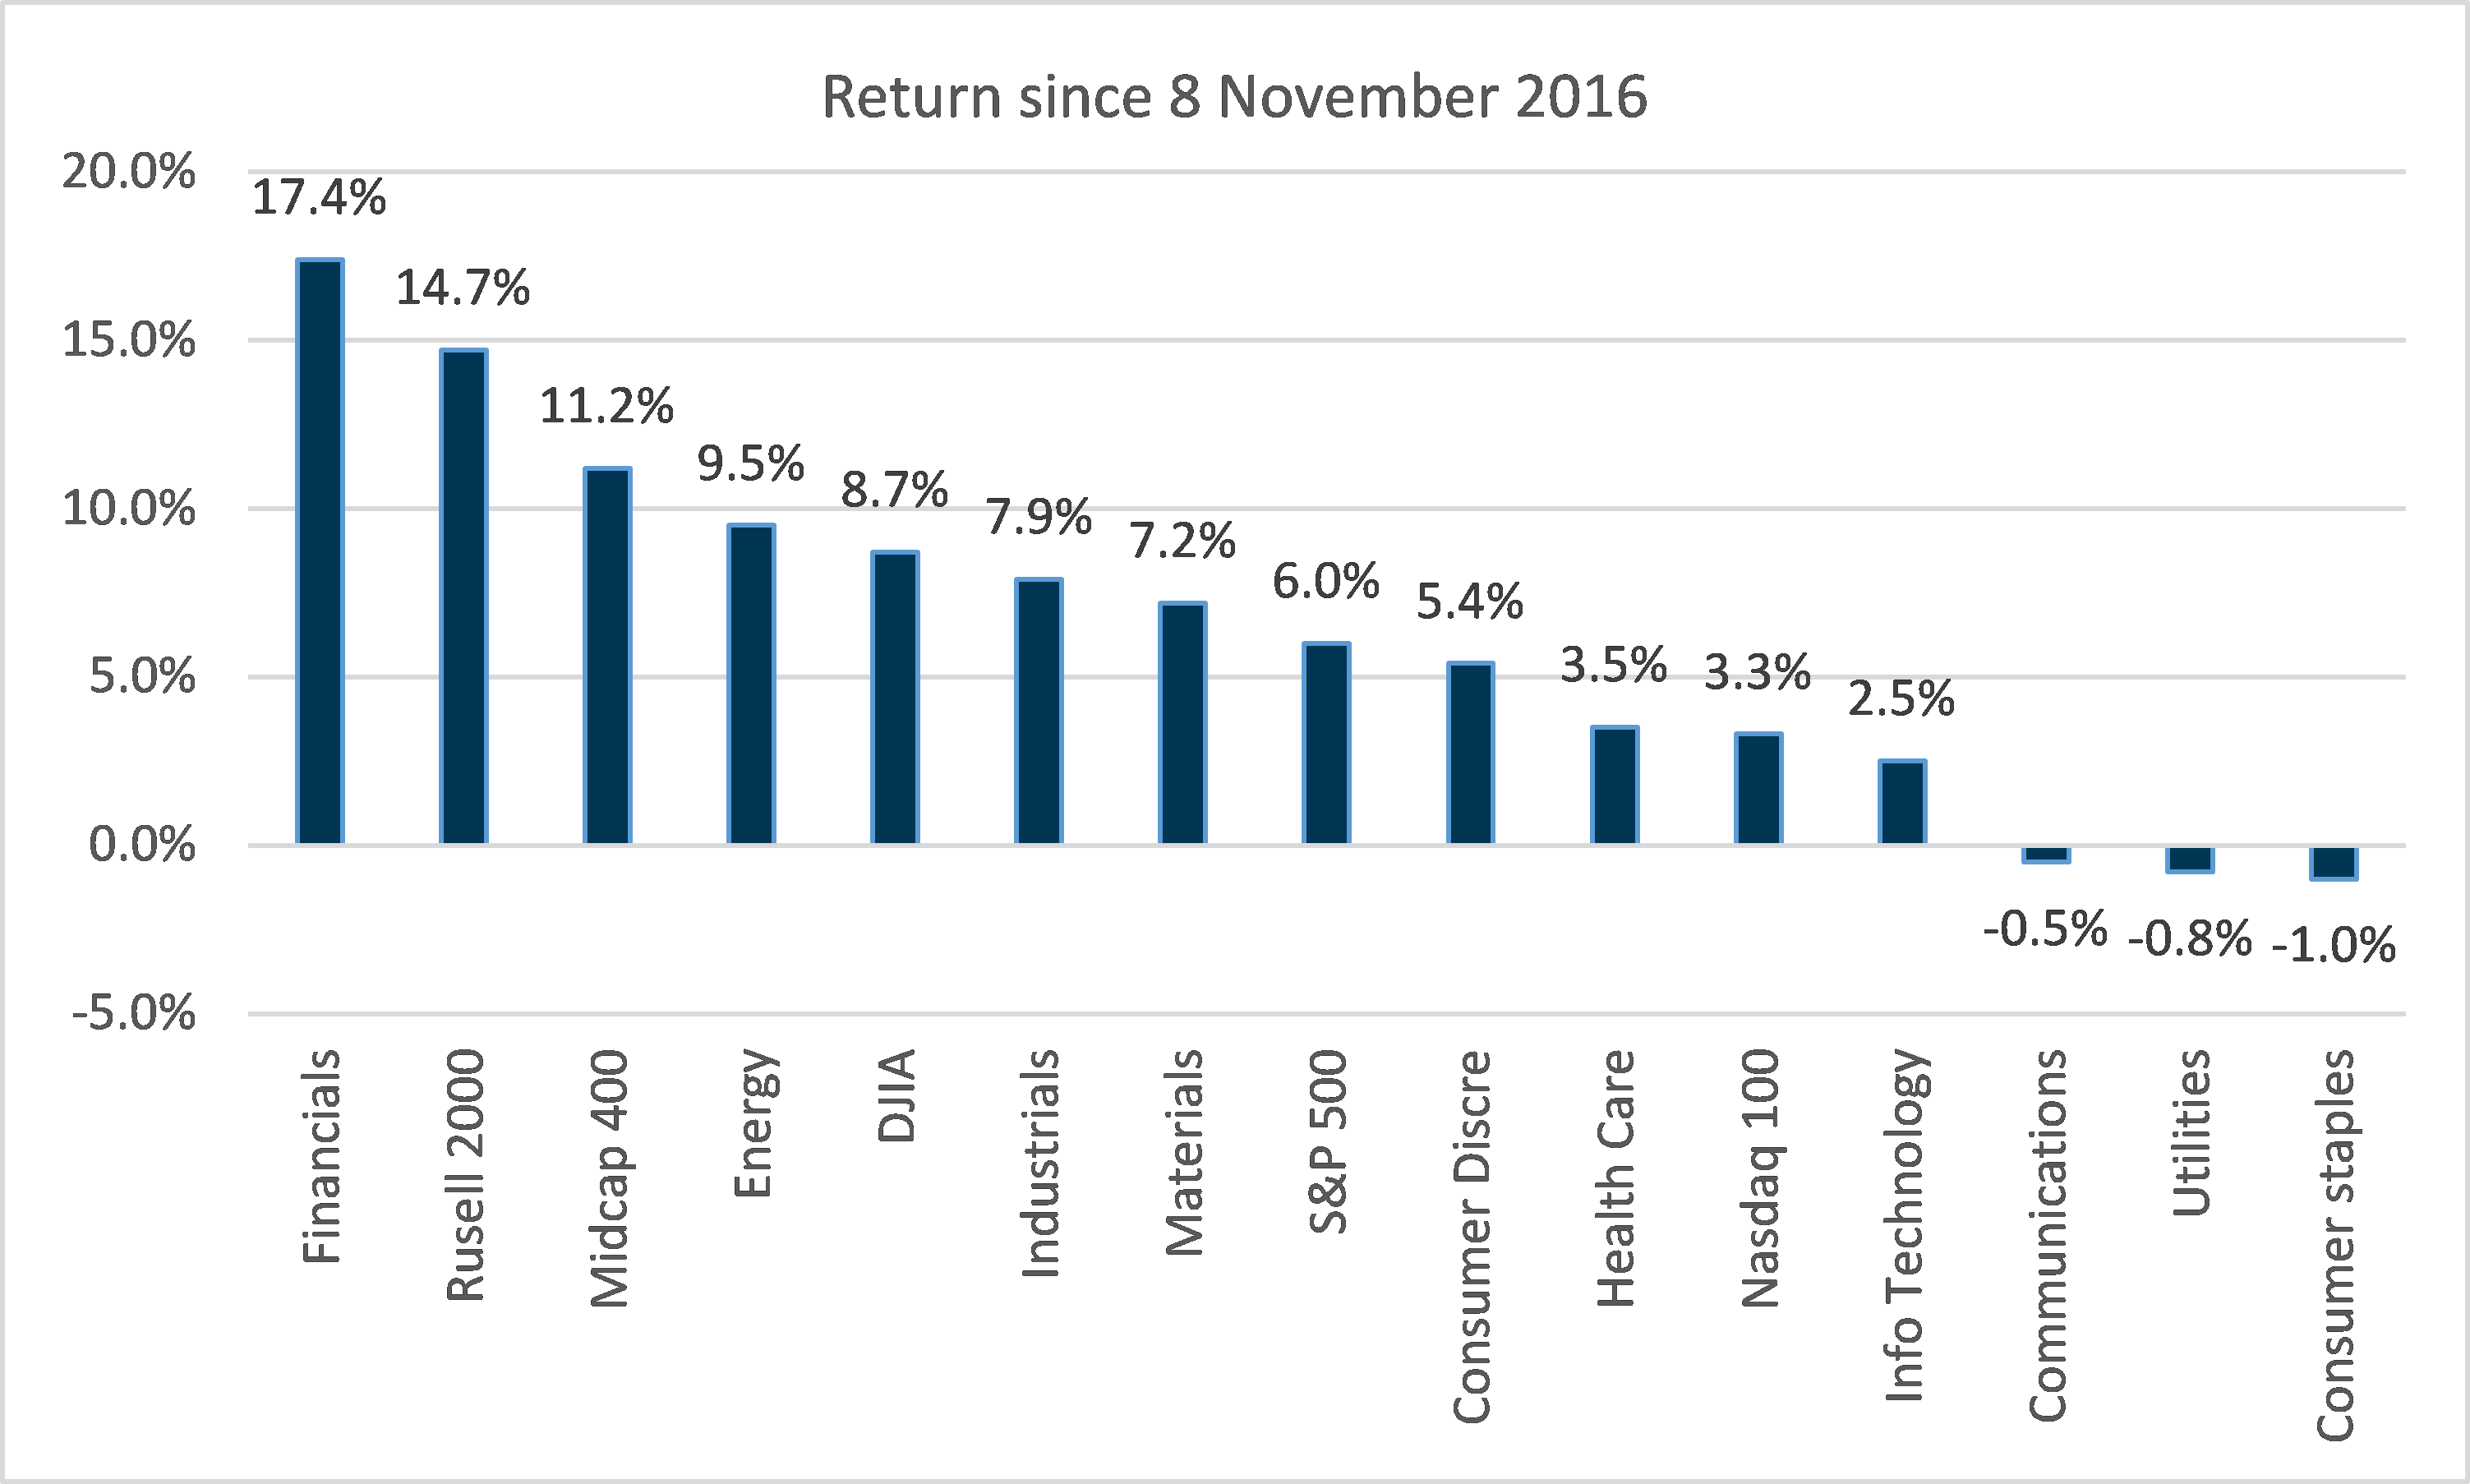
Source: Bloomberg
The biggest winner of the Trump rally is the financial sector followed by energy sector but we believe that the Trump rally has entered into an euphoric state and the election cycle suggests the Trump rally might fizzle out soon and enter into a correction phase. The market is clearly shifting into a risk on mode but it would be better to stay on the side lines rather than chase the market as valuations have hit the extreme levels last seen during crisis periods. S&P 500 Forward PE is at 18.8, surpassing the peak during subprime crisis.
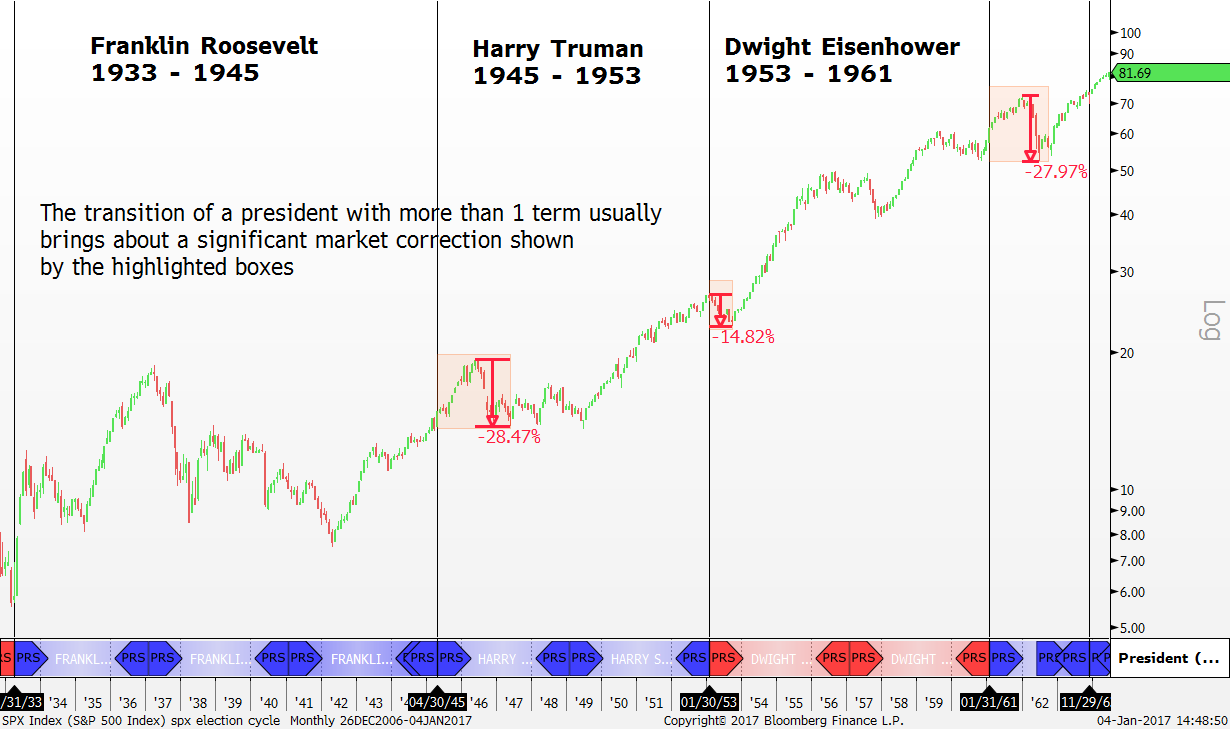
Change of President with more than 1 term cycle
This study was done on the S&P 500 Index to observe the price action around the US president inauguration day and it dates back to 1933. A clear pattern emerged as the US election cycle shows the US equity market tends to top out and correct somewhere near the US presidential inauguration day and the pattern is more pronounced when we get a change in regime of presidents that have stayed in power over the white house for more than one term.
In total, there were eight different occasions where the respective US presidents held office for more than one term and all eight occasions produced interesting price action around the inauguration day of the following president.
All in all, the correction was more prominent when the top was form prior to the inauguration day. Take for example the 1963 – 1969, 1969 – 1974, 1993 – 2001 and 2001 -2009 election cycle, the top was formed on average 11 months before the inauguration day of the following president and the corrections that ensued were in the vicinity of 50% from the peak.
|
||||||||||||||||||||||||||||||||||||||||||||
| Currently, the S&P 500 index has continued to break new record highs and its trading at 2269 points while the existing all-time high stands at 2277 points. The inauguration of Donald Trump as the president of United States will occur on 20 January 2017. |
Scenario 1 – immediate correction
If the S&P 500 index manages to hold on to the December 2016 top as the all-time high, expect a significant correction to take place in the range of 50% based on the election cycle. That scenario resembles the 1969 presidential cycle where the top was formed two months before the inauguration day of the 37th president of the United States, Richard Nixon in January 1969 where the S&P 500 Index tanked 36% subsequently(chart 2b).
Scenario 2 – delayed correction
On the other hand, if the S&P 500 index continues to break new record highs after 20 January, 2017, the Trump rally could get extended for another 12 months before the all-time high appears.
| Chart 2a. S&P 500 Index 1933 – 1963 |
| Chart 2b. S&P 500 Index 1963 – 1991 |
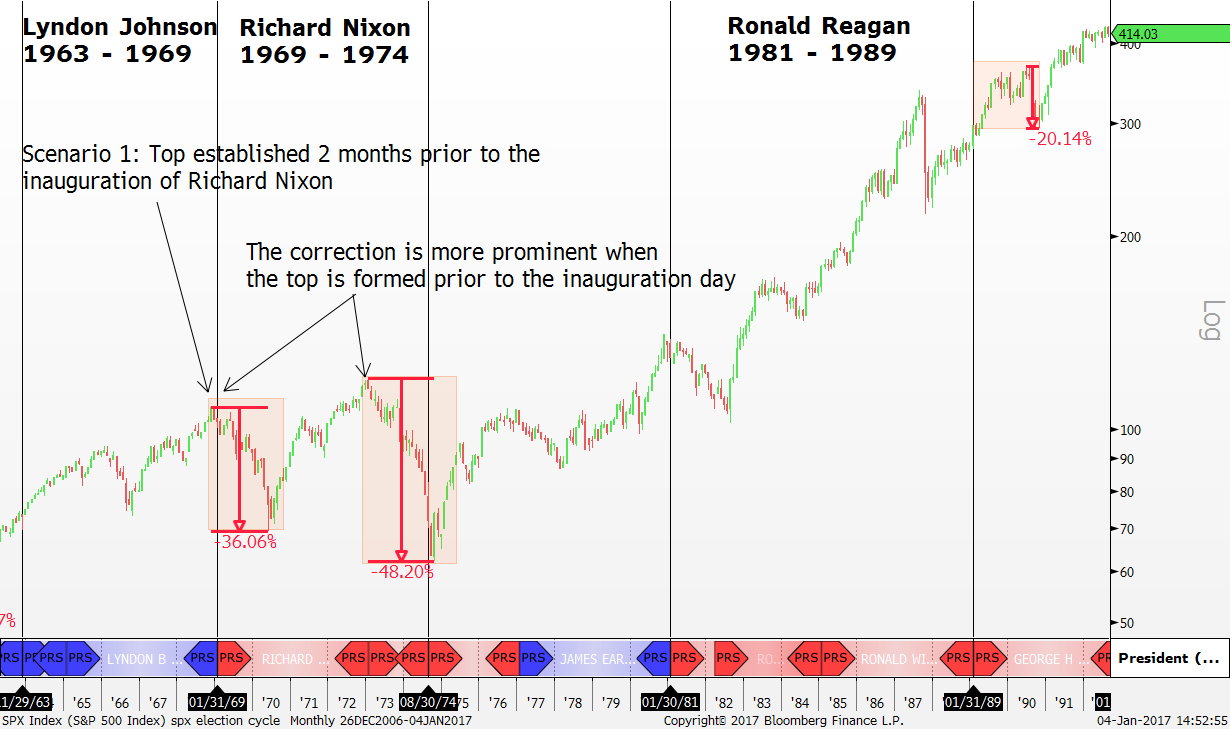
Chart 2c. S&P 500 Index 1993 – 2017
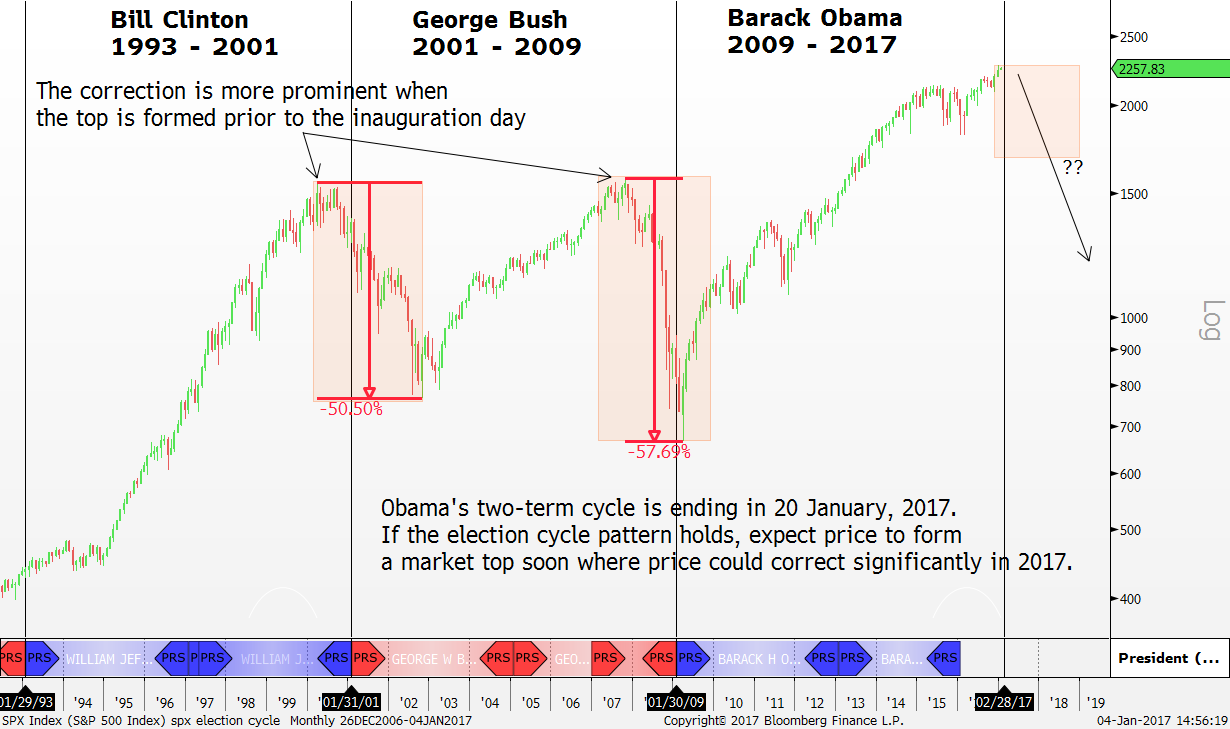
*Vertical line demarcates the respective inauguration day Source: Bloomberg
Please sign up to read the full report.
Important Information
This report is prepared and/or distributed by Phillip Securities Research Pte Ltd ("Phillip Securities Research"), which is a holder of a financial adviser’s licence under the Financial Advisers Act, Chapter 110 in Singapore.
By receiving or reading this report, you agree to be bound by the terms and limitations set out below. Any failure to comply with these terms and limitations may constitute a violation of law. This report has been provided to you for personal use only and shall not be reproduced, distributed or published by you in whole or in part, for any purpose. If you have received this report by mistake, please delete or destroy it, and notify the sender immediately.
The information and any analysis, forecasts, projections, expectations and opinions (collectively, the “Research”) contained in this report has been obtained from public sources which Phillip Securities Research believes to be reliable. However, Phillip Securities Research does not make any representation or warranty, express or implied that such information or Research is accurate, complete or appropriate or should be relied upon as such. Any such information or Research contained in this report is subject to change, and Phillip Securities Research shall not have any responsibility to maintain or update the information or Research made available or to supply any corrections, updates or releases in connection therewith.
Any opinions, forecasts, assumptions, estimates, valuations and prices contained in this report are as of the date indicated and are subject to change at any time without prior notice. Past performance of any product referred to in this report is not indicative of future results.
This report does not constitute, and should not be used as a substitute for, tax, legal or investment advice. This report should not be relied upon exclusively or as authoritative, without further being subject to the recipient’s own independent verification and exercise of judgment. The fact that this report has been made available constitutes neither a recommendation to enter into a particular transaction, nor a representation that any product described in this report is suitable or appropriate for the recipient. Recipients should be aware that many of the products, which may be described in this report involve significant risks and may not be suitable for all investors, and that any decision to enter into transactions involving such products should not be made, unless all such risks are understood and an independent determination has been made that such transactions would be appropriate. Any discussion of the risks contained herein with respect to any product should not be considered to be a disclosure of all risks or a complete discussion of such risks.
Nothing in this report shall be construed to be an offer or solicitation for the purchase or sale of any product. Any decision to purchase any product mentioned in this report should take into account existing public information, including any registered prospectus in respect of such product.
Phillip Securities Research, or persons associated with or connected to Phillip Securities Research, including but not limited to its officers, directors, employees or persons involved in the issuance of this report, may provide an array of financial services to a large number of corporations in Singapore and worldwide, including but not limited to commercial / investment banking activities (including sponsorship, financial advisory or underwriting activities), brokerage or securities trading activities. Phillip Securities Research, or persons associated with or connected to Phillip Securities Research, including but not limited to its officers, directors, employees or persons involved in the issuance of this report, may have participated in or invested in transactions with the issuer(s) of the securities mentioned in this report, and may have performed services for or solicited business from such issuers. Additionally, Phillip Securities Research, or persons associated with or connected to Phillip Securities Research, including but not limited to its officers, directors, employees or persons involved in the issuance of this report, may have provided advice or investment services to such companies and investments or related investments, as may be mentioned in this report.
Phillip Securities Research or persons associated with or connected to Phillip Securities Research, including but not limited to its officers, directors, employees or persons involved in the issuance of this report may, from time to time maintain a long or short position in securities referred to herein, or in related futures or options, purchase or sell, make a market in, or engage in any other transaction involving such securities, and earn brokerage or other compensation in respect of the foregoing. Investments will be denominated in various currencies including US dollars and Euro and thus will be subject to any fluctuation in exchange rates between US dollars and Euro or foreign currencies and the currency of your own jurisdiction. Such fluctuations may have an adverse effect on the value, price or income return of the investment.
To the extent permitted by law, Phillip Securities Research, or persons associated with or connected to Phillip Securities Research, including but not limited to its officers, directors, employees or persons involved in the issuance of this report, may at any time engage in any of the above activities as set out above or otherwise hold an interest, whether material or not, in respect of companies and investments or related investments, which may be mentioned in this report. Accordingly, information may be available to Phillip Securities Research, or persons associated with or connected to Phillip Securities Research, including but not limited to its officers, directors, employees or persons involved in the issuance of this report, which is not reflected in this report, and Phillip Securities Research, or persons associated with or connected to Phillip Securities Research, including but not limited to its officers, directors, employees or persons involved in the issuance of this report, may, to the extent permitted by law, have acted upon or used the information prior to or immediately following its publication. Phillip Securities Research, or persons associated with or connected to Phillip Securities Research, including but not limited its officers, directors, employees or persons involved in the issuance of this report, may have issued other material that is inconsistent with, or reach different conclusions from, the contents of this report.
The information, tools and material presented herein are not directed, intended for distribution to or use by, any person or entity in any jurisdiction or country where such distribution, publication, availability or use would be contrary to the applicable law or regulation or which would subject Phillip Securities Research to any registration or licensing or other requirement, or penalty for contravention of such requirements within such jurisdiction.
This report is intended for general circulation only and does not take into account the specific investment objectives, financial situation or particular needs of any particular person. The products mentioned in this report may not be suitable for all investors and a person receiving or reading this report should seek advice from a professional and financial adviser regarding the legal, business, financial, tax and other aspects including the suitability of such products, taking into account the specific investment objectives, financial situation or particular needs of that person, before making a commitment to invest in any of such products.
This report is not intended for distribution, publication to or use by any person in any jurisdiction outside of Singapore or any other jurisdiction as Phillip Securities Research may determine in its absolute discretion.
IMPORTANT DISCLOSURES FOR INCLUDED RESEARCH ANALYSES OR REPORTS OF FOREIGN RESEARCH HOUSE
Where the report contains research analyses or reports from a foreign research house, please note:

Jeremy specialises in Technical Analysis and has 10 years of experience in studying price action. His areas of expertise include intermarket analysis on the equities, currencies, commodities and bonds market.
He is also a regular columnist on The Business Times - every Monday ChartPoint column.
He graduated with a Bachelor of Science in Banking and Finance from University of London.
