
There were 3 big risks that were plaguing the market in April. Namely:
At the pinnacle of the trade war fear after China responded with a $50 Billion retaliatory tariff on US goods, the US equity market sold off sharply initially on 2 April. However, since then, we have seen a strong rebound in the US equity market as the market expects the worse of the trade war is over. Despite further threats by the US to further impose new tariffs on another $100 Billion in Chinese goods subsequently on 5 April, the general equity market continued to recover suggesting the market is getting used to President Trump’s threatening tweets.
Moreover, the market reaction to the airstrikes in Syria by US, France and UK appeared muted with minimal adverse impact. On the weekend of 15 April, the US, UK and France launched more than 100 missiles into Syria in response to an alleged chemical weapon attack by the Assad regime. However, this is not the first time the US launched an airstrike into Syria. On 7 April 2017, US launched 59 Tomahawk cruise missiles into Syria as a response to the alleged use of chemical weapons on civilians. The reaction by the market was rather muted after the US launched the airstrike. The S&P 500 index only fell approximately -2% over the next two weeks before rebounding back into the uptrend. Hence, we treat this piece of news more like noise where it should be a one-off event and not have any lasting negative impact on the US equity market.
With all these negative news flow surrounding the market lately in April, the opposite positive move in the equity market is encouraging as it signals that the risk-on sentiment is back. The S&P 500 index was up +1.36% in April which is a positive sign. Even with the most recent bond rout scare as the 10-year treasury yield flirted with the 3% psychological round number, the crucial 200-day moving average on the DJIA, S&P 500 and Nasdaq 100 index held up firmly showing the risk-on appetite is still present.
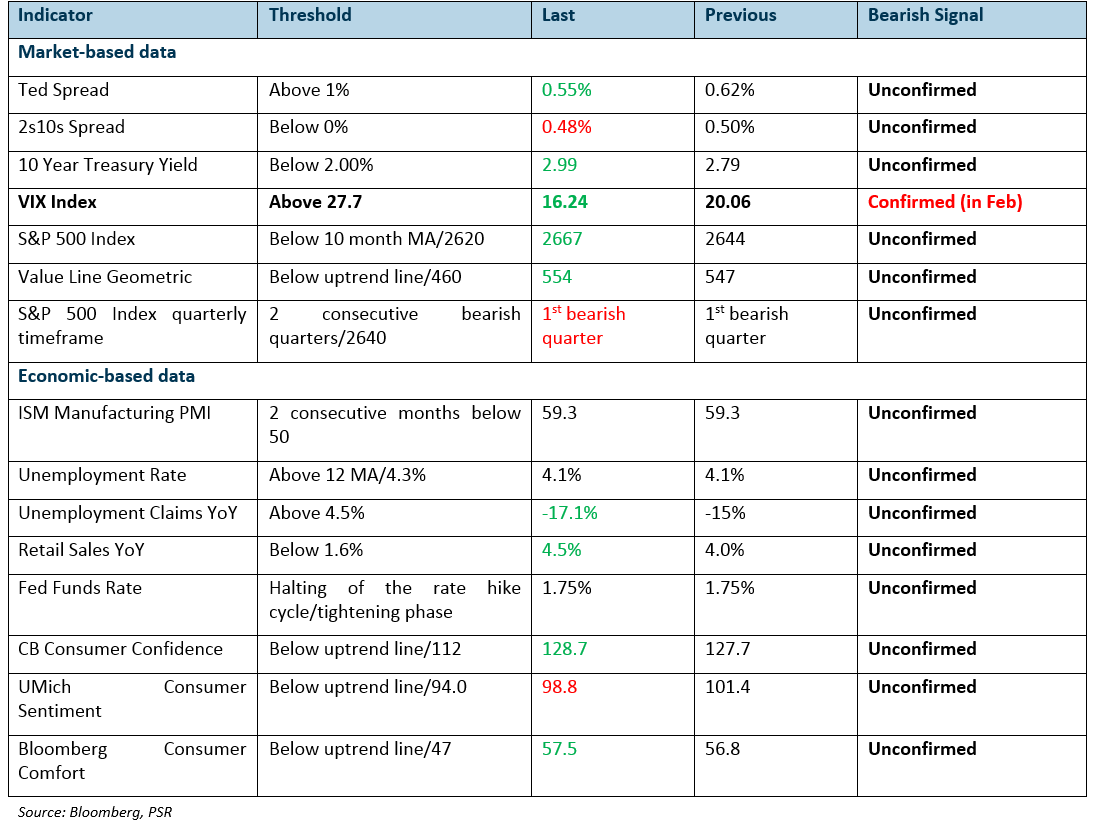
Reviewing the “Phillip Monthly Recession Tracker” for April also showed some sigh of relief after some early crack signs appeared in March. The key indicators mentioned in March such as the Ted Spread, 2s10s spread and VIX index have all retrace back to a more normal range rather than breaking into new space. Furthermore, the economic-based data are all still at their multi-year extremes, exhibiting rosy outlook.
Figure 1: Phillip Recession Tracker – well in check
TED Spread
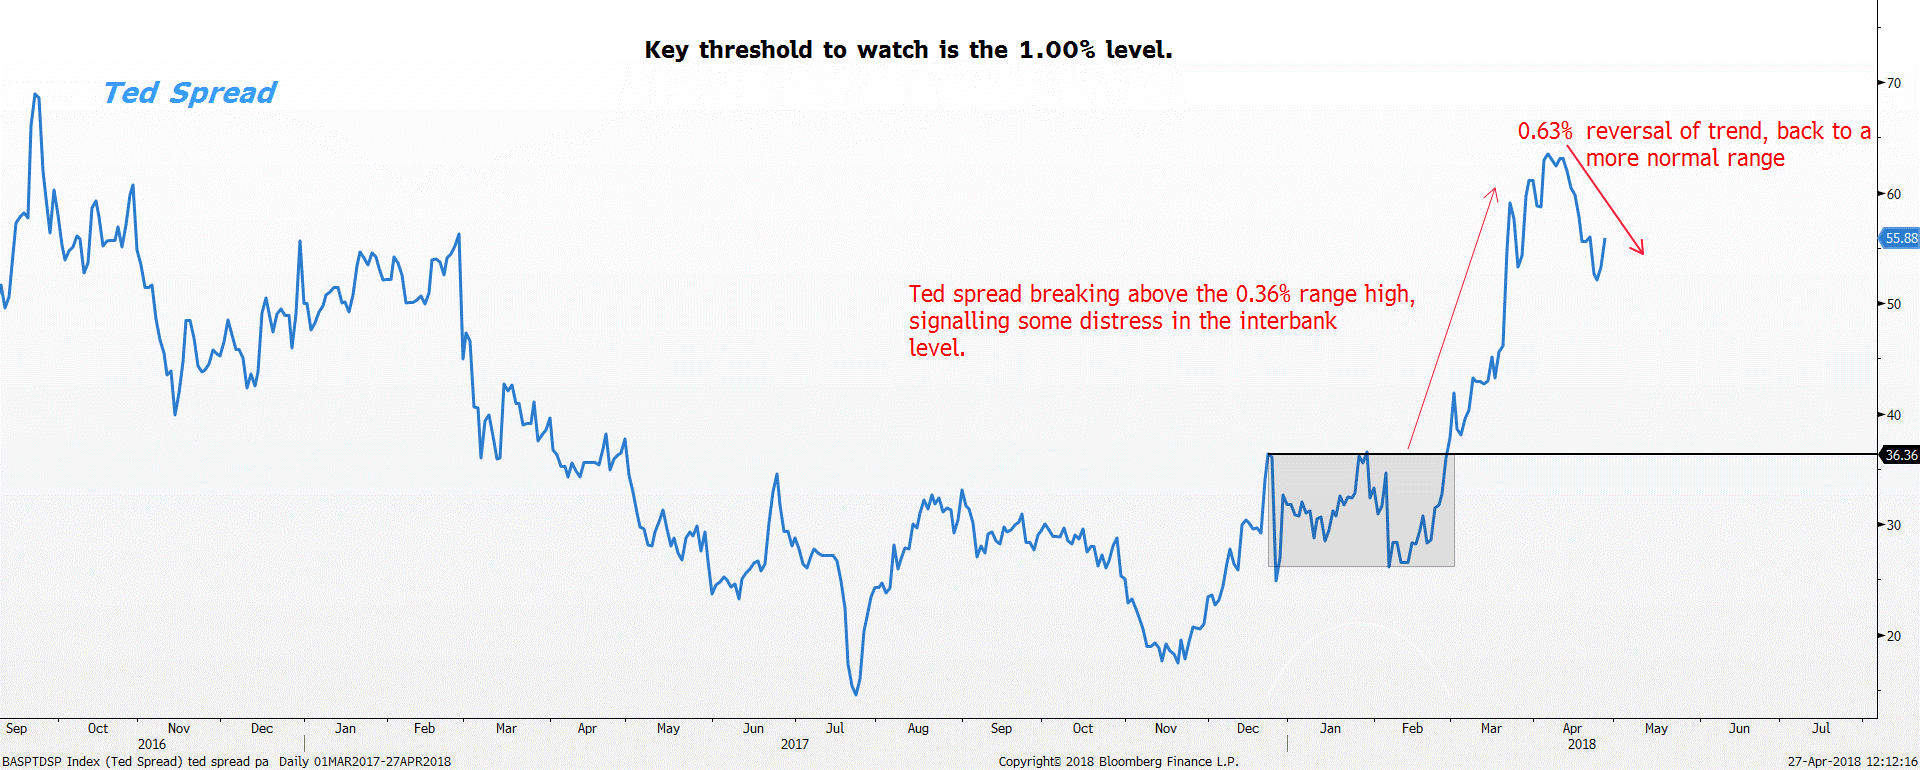
In the earlier part of April, the TED spread continued to signal interbank distress as it hit a new 52-week high of 0.63%. However, as the month comes to an end, the TED spread subsided off the 0.63% high and closed safely back into the 0.53% range which is a positive sign.
Note the key threshold to watch is the 1% level for the TED spread to signal the start of the bearish trend. All seems well again from the TED spread lens.
Figure 2: TED Spread – signalling distress in the interbank level
VIX Index
The VIX index has also retraced back below the 20 range suggests the market has moved back into a more subdued environment. The VIX index stayed relatively tame despite two sharp down days in April. On 2 April and 6 April, the S&P 500 index was down -2% and -2.14% where the VIX index spiked up +18% and +13% respectively.
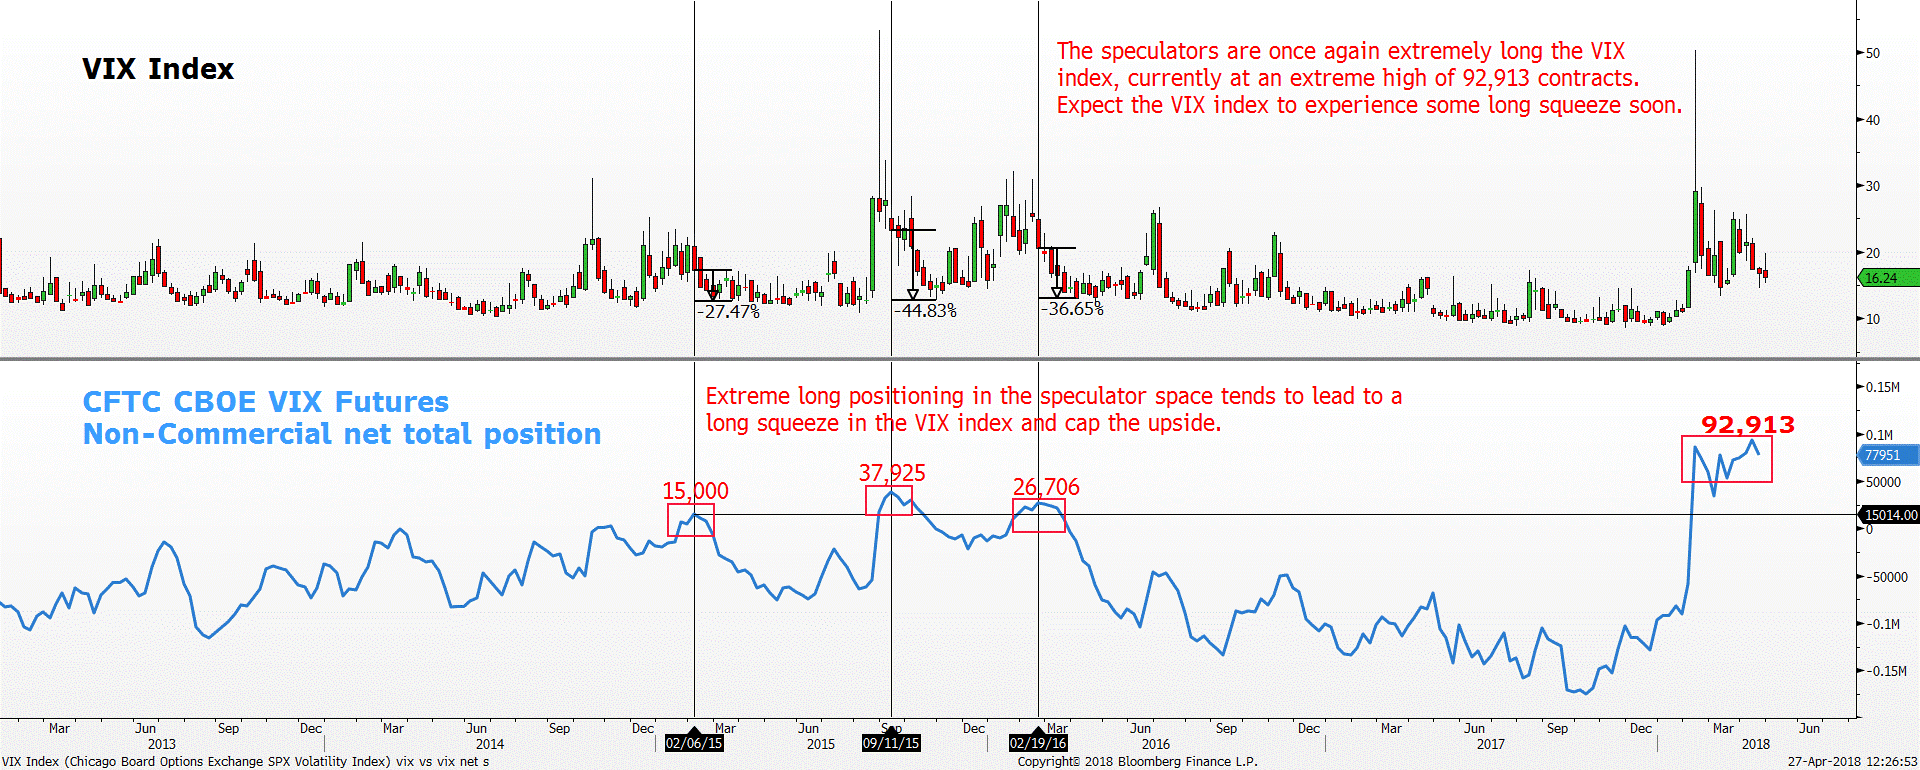
We expect the VIX index to trade relatively calm in the near future due to the extreme longs that have been building up in the speculator space. According to the Commitment of Traders(COT) report, the Net Non-Commercial/speculators positioning is currently at a record extreme high suggesting an overcrowded long trade in the VIX index, betting on higher VIX index. However, do note that the speculators provide good contrarian signals especially when the net positioning enters into the extremes. Put differently, when the crowd is all on one side, they are always wrong, and a huge reversal is imminent.
Figure 3: VIX Index Weekly Timeframe – Speculators are extremely long

Jeremy specialises in Technical Analysis and has 10 years of experience in studying price action. His areas of expertise include intermarket analysis on the equities, currencies, commodities and bonds market.
He is also a regular columnist on The Business Times - every Monday ChartPoint column.
He graduated with a Bachelor of Science in Banking and Finance from University of London.
