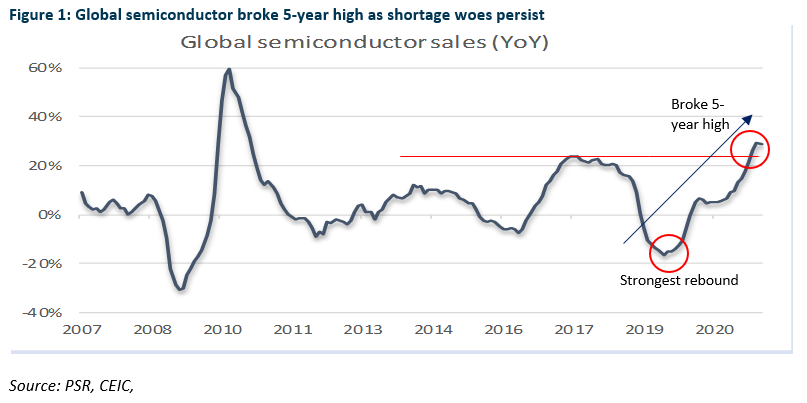
The semiconductor sales worldwide have seen a huge jumped with growth rates breaking the 5-year high in 2020
The imbalance of supply and demand of the semiconductors is set to cause further price increases. Taiwan Semiconductor is the first to announced the 20% hike in prices in August 2021. With the complexity and sophiscated manufacturing of the semiconductor chips together with COVID-19 lock down last year has further disrupted the manufacturing process. This has caused severe backlog in supplies and it is expected to continue well into 2Q22.
From the chart shown, expect some drop of the global sales to 20% region in the short-term before rebounding as the month of September has shown slight decrease in growth rate after breaking the 5 year high by 2%. The correction in global sales growth is in tandem with the Philadelphia Stock Exchange Semiconductor Index (Fig 2a), where a potential rebound will happen after a correction.
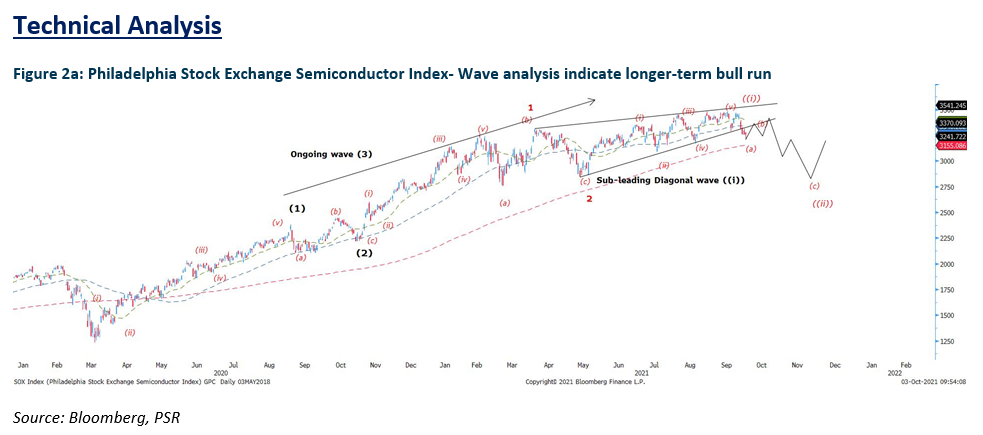
Despite the ongoing contraction and possible correction in the technical price structure, longer-term wave analysis indicate a strong bullish run as wave (3) of the intermediate wave is ongoing. Currently, the minor phase of wave 1-2 of the larger wave (3) has been completed and the sub-leading diagonal wave ((i)) is part of the sub-wave 3 of the minor phase. In other words, the intermediate wave (3) will be embarking on a long journey of a strong bullish upside in the longer-term period.
However, there is one crucial factor to consider. The psychological support at 2,750 must hold. If it is broken below, the rate of probability of sub-wave 3 of the minor phase will cease and the sub-leading diagonal wave ((i)) will turn into an ending diagonal.
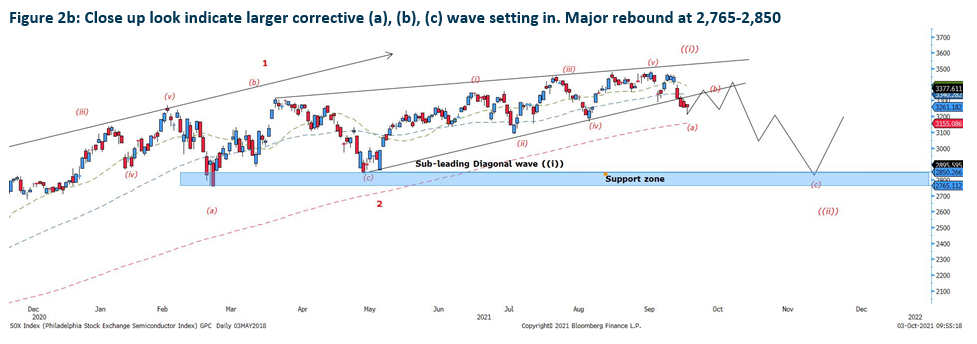
Although price action indicates a bullish pin-bar on Friday above the 200-day moving average, the upside remains corrective with prices facing a tough sell-off at 3,400. Furthermore, SOX index has crosses below the 22 and 63-day moving average.
Potential key rebound remain at the support zone at 2,765-2,850.
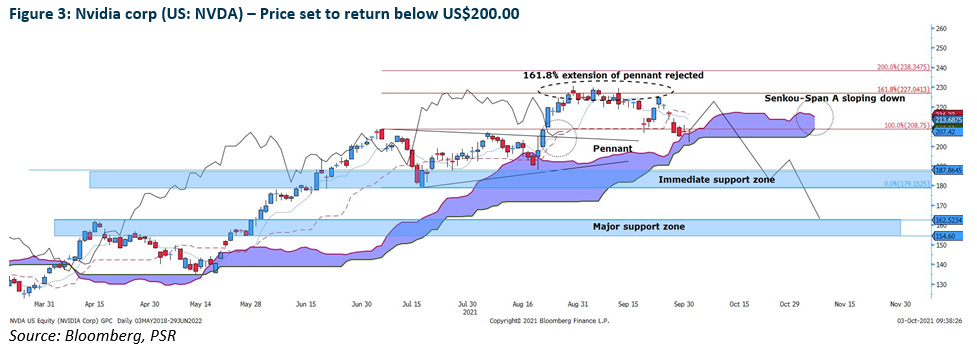
Nvidia Corp has shown strong upside in March this year after a three-month ranging period. Unlike other chips companies, Nvidia is set to face another round of large correction after prices hit a high at US$230.00 region. The rejection of 161.8% extension level of the previous pennant indicates a weaker than expected rebound as pennant target are normally at the 200.00 Fibonacci extension level. To confirm the correction, the stock has closed below the resistance turned support at US$208.75 and Ichimoku indicator has shown signs of slowdown after Senkou-Span A has close slope below, the candle closing below both the Tenkan-Sen and Kijun-Sen and lagging span breaking below the candles.
Short-term rebound will be seen after last Friday close with a bullish dragonfly doji. However, US$220.00-US$228.00 is seen as a strong contender for a sell-down. Only by breaking above US$240.00 within a month then we will see the return of the bullish upside.
Important Information
This report is prepared and/or distributed by Phillip Securities Research Pte Ltd ("Phillip Securities Research"), which is a holder of a financial adviser’s licence under the Financial Advisers Act, Chapter 110 in Singapore.
By receiving or reading this report, you agree to be bound by the terms and limitations set out below. Any failure to comply with these terms and limitations may constitute a violation of law. This report has been provided to you for personal use only and shall not be reproduced, distributed or published by you in whole or in part, for any purpose. If you have received this report by mistake, please delete or destroy it, and notify the sender immediately.
The information and any analysis, forecasts, projections, expectations and opinions (collectively, the “Research”) contained in this report has been obtained from public sources which Phillip Securities Research believes to be reliable. However, Phillip Securities Research does not make any representation or warranty, express or implied that such information or Research is accurate, complete or appropriate or should be relied upon as such. Any such information or Research contained in this report is subject to change, and Phillip Securities Research shall not have any responsibility to maintain or update the information or Research made available or to supply any corrections, updates or releases in connection therewith.
Any opinions, forecasts, assumptions, estimates, valuations and prices contained in this report are as of the date indicated and are subject to change at any time without prior notice. Past performance of any product referred to in this report is not indicative of future results.
This report does not constitute, and should not be used as a substitute for, tax, legal or investment advice. This report should not be relied upon exclusively or as authoritative, without further being subject to the recipient’s own independent verification and exercise of judgment. The fact that this report has been made available constitutes neither a recommendation to enter into a particular transaction, nor a representation that any product described in this report is suitable or appropriate for the recipient. Recipients should be aware that many of the products, which may be described in this report involve significant risks and may not be suitable for all investors, and that any decision to enter into transactions involving such products should not be made, unless all such risks are understood and an independent determination has been made that such transactions would be appropriate. Any discussion of the risks contained herein with respect to any product should not be considered to be a disclosure of all risks or a complete discussion of such risks.
Nothing in this report shall be construed to be an offer or solicitation for the purchase or sale of any product. Any decision to purchase any product mentioned in this report should take into account existing public information, including any registered prospectus in respect of such product.
Phillip Securities Research, or persons associated with or connected to Phillip Securities Research, including but not limited to its officers, directors, employees or persons involved in the issuance of this report, may provide an array of financial services to a large number of corporations in Singapore and worldwide, including but not limited to commercial / investment banking activities (including sponsorship, financial advisory or underwriting activities), brokerage or securities trading activities. Phillip Securities Research, or persons associated with or connected to Phillip Securities Research, including but not limited to its officers, directors, employees or persons involved in the issuance of this report, may have participated in or invested in transactions with the issuer(s) of the securities mentioned in this report, and may have performed services for or solicited business from such issuers. Additionally, Phillip Securities Research, or persons associated with or connected to Phillip Securities Research, including but not limited to its officers, directors, employees or persons involved in the issuance of this report, may have provided advice or investment services to such companies and investments or related investments, as may be mentioned in this report.
Phillip Securities Research or persons associated with or connected to Phillip Securities Research, including but not limited to its officers, directors, employees or persons involved in the issuance of this report may, from time to time maintain a long or short position in securities referred to herein, or in related futures or options, purchase or sell, make a market in, or engage in any other transaction involving such securities, and earn brokerage or other compensation in respect of the foregoing. Investments will be denominated in various currencies including US dollars and Euro and thus will be subject to any fluctuation in exchange rates between US dollars and Euro or foreign currencies and the currency of your own jurisdiction. Such fluctuations may have an adverse effect on the value, price or income return of the investment.
To the extent permitted by law, Phillip Securities Research, or persons associated with or connected to Phillip Securities Research, including but not limited to its officers, directors, employees or persons involved in the issuance of this report, may at any time engage in any of the above activities as set out above or otherwise hold an interest, whether material or not, in respect of companies and investments or related investments, which may be mentioned in this report. Accordingly, information may be available to Phillip Securities Research, or persons associated with or connected to Phillip Securities Research, including but not limited to its officers, directors, employees or persons involved in the issuance of this report, which is not reflected in this report, and Phillip Securities Research, or persons associated with or connected to Phillip Securities Research, including but not limited to its officers, directors, employees or persons involved in the issuance of this report, may, to the extent permitted by law, have acted upon or used the information prior to or immediately following its publication. Phillip Securities Research, or persons associated with or connected to Phillip Securities Research, including but not limited its officers, directors, employees or persons involved in the issuance of this report, may have issued other material that is inconsistent with, or reach different conclusions from, the contents of this report.
The information, tools and material presented herein are not directed, intended for distribution to or use by, any person or entity in any jurisdiction or country where such distribution, publication, availability or use would be contrary to the applicable law or regulation or which would subject Phillip Securities Research to any registration or licensing or other requirement, or penalty for contravention of such requirements within such jurisdiction.
This report is intended for general circulation only and does not take into account the specific investment objectives, financial situation or particular needs of any particular person. The products mentioned in this report may not be suitable for all investors and a person receiving or reading this report should seek advice from a professional and financial adviser regarding the legal, business, financial, tax and other aspects including the suitability of such products, taking into account the specific investment objectives, financial situation or particular needs of that person, before making a commitment to invest in any of such products.
This report is not intended for distribution, publication to or use by any person in any jurisdiction outside of Singapore or any other jurisdiction as Phillip Securities Research may determine in its absolute discretion.
IMPORTANT DISCLOSURES FOR INCLUDED RESEARCH ANALYSES OR REPORTS OF FOREIGN RESEARCH HOUSE
Where the report contains research analyses or reports from a foreign research house, please note:
