
After the most recent FOMC meeting in June 2017 the precious metals market got heavily hit as Gold and Silver fell to a low of $1205 and $14 respectively. The reason for the strong sell off in Gold and Silver was mainly due to the new hawkish language from the Fed as they explained how they would begin the balance sheet reduction by the end of 2017 if the economic data continues to improve.Nonetheless, our long term view on Gold remains bullish and the recent sell off have presented a good opportunity to hop back on to the long term uptrend.
Nonetheless, our long term view on Gold remains bullish and the recent sell off have presented a good opportunity to hop back on to the long term uptrend.
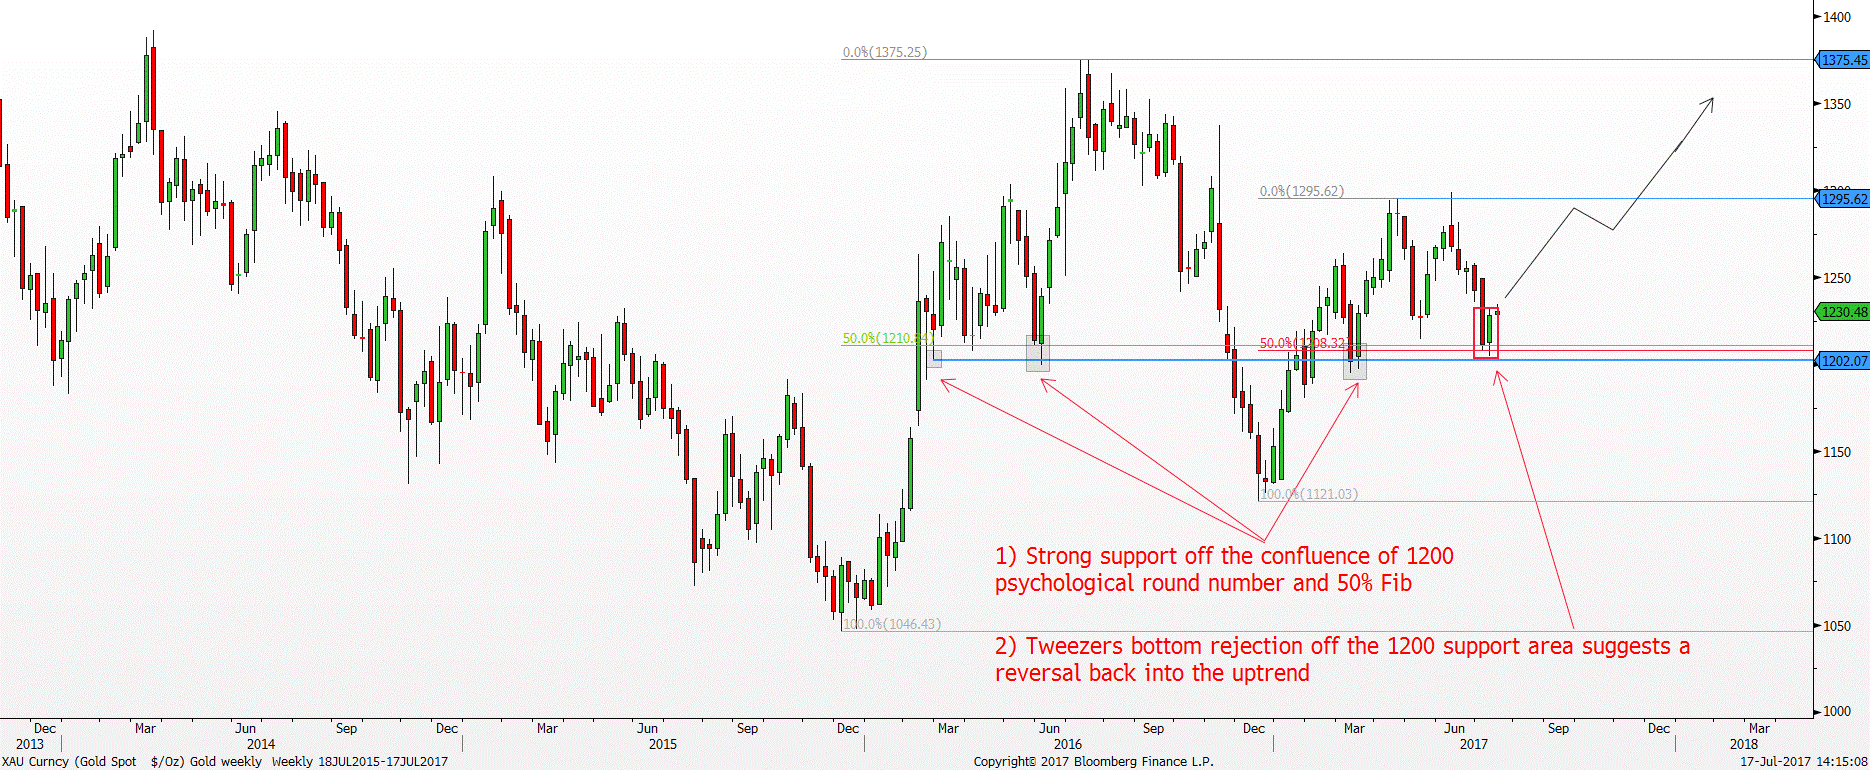
Strong support off the $1200 psychological round number
The strong support off the confluence of $1200 psychological round number and 50% Fibonacci retracement level from both the December 2015 – July 2016 uptrend and December 2016 – April 2017 uptrend have managed to reverse the sell off shown by the tweezers bottom rejection on the week ended 14 July 2017.
on the week ended 14 July 2017.
Figure 1. Gold weekly chart – Tweezers bottom rejection off the $1200 support
Source: Bloomberg
| Oversold RSI signalling a bottom is in sight
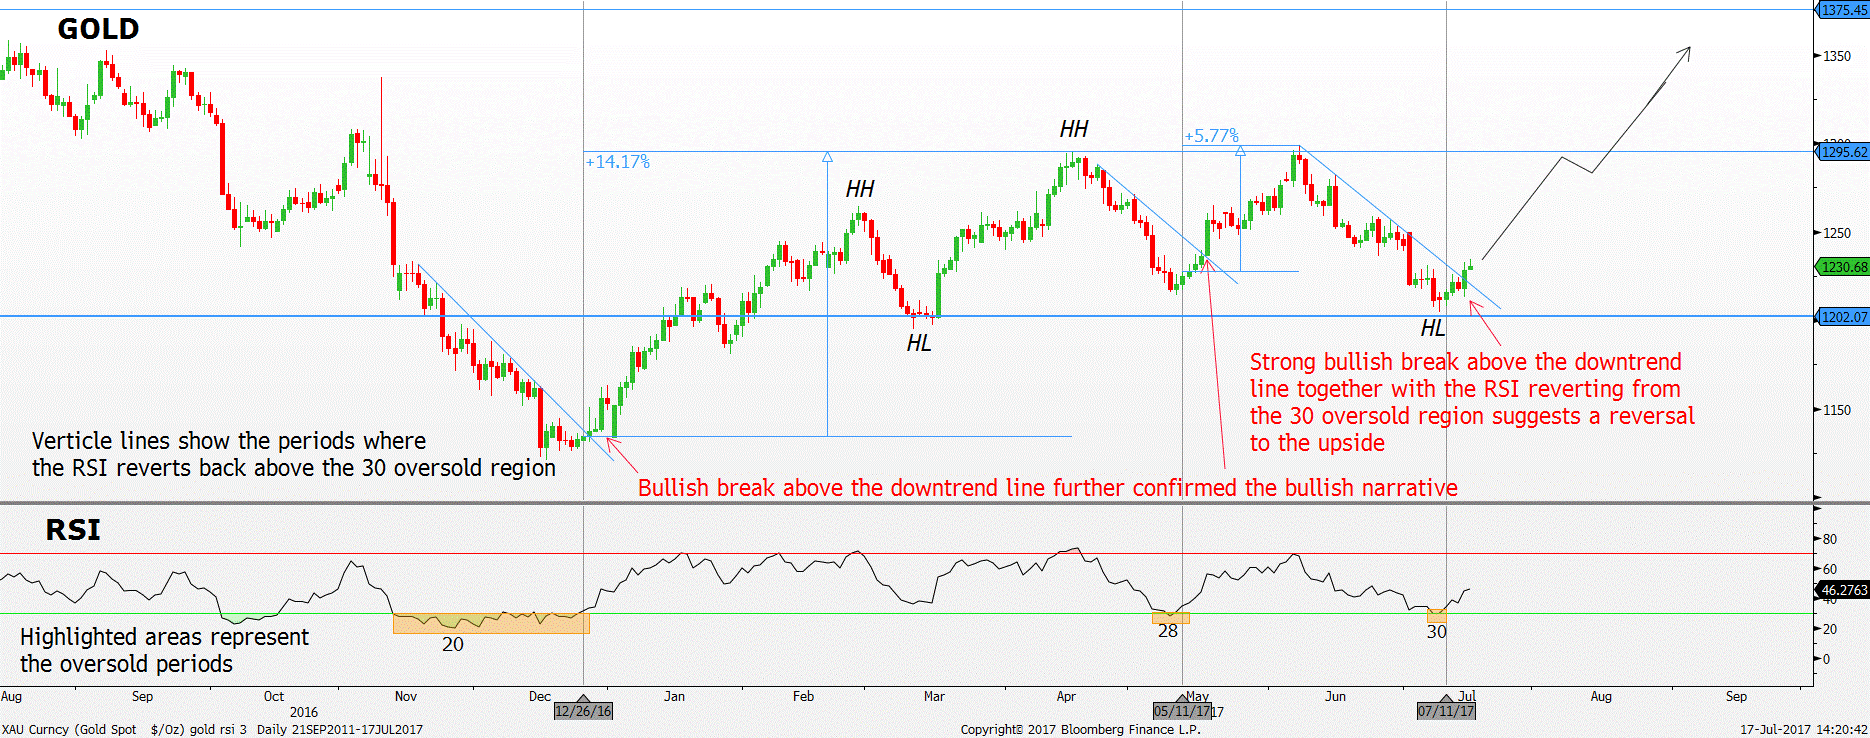
More importantly, looking at the price action around the $1200 support area shows promising sign of a higher low bottom. As mentioned in the previous report “Buy the dips” on the relative performance of Gold when the Relative Strength Index(RSI) reaches oversold, Gold tends to rebound when the RSI reverts to the mean after overextending into the 30 oversold territory. Following the RSI report, there were two more instances where the RSI signalled the bottoming process in December 2016 and May 2017. |
Figure 2. Gold daily chart – Reversion of the oversold RSI points toward the resumption of the uptrend
Source: Bloomberg
| Gold effectively found a significant higher low point around December 2016 as the RSI recovered off the 22 oversold RSI on 15 December 2016. The confirmation of the bottom happened on 26 December 2017 after the RSI rebounded above the 30 RSI reading as price broke above the immediate downtrend line. Since then, Gold rallied sharply for 14% to a high of $1295 in April 2017.
The next bottom that was signaled by the oversold RSI occurred in May 2017 after the RSI hit a low of 28 on 9 May 2017. As the RSI recoiled off the oversold region on 11 May 2017, Gold leaped higher back into the uptrend and gained 6%. The oversold RSI is flashing red once again with recent reading hitting a low of 30 on 7 July 2017. From the price action perspective, the support off the psychological $1200 area and 50% Fibonacci retracement level is showing a great deal of support as it readily rejected price. As a result, the hammer rejection off the $1200 psychological support area on 10 July 2017 could be the next higher low point within this uptrend. Moreover, the RSI is also rebounding perfectly off the 30 oversold region since 7 July 2017 implies a reversal back into the uptrend where it currently stands at 47. Additionally, there was a subsequent bullish break above the downtrend line on 14 July 2017 suggests a shift in sentiment to the upside. Hence from both the price action and RSI point of view, Gold seems ready to turn back into the uptrend from here. For the current up leg, expect Gold to retest the $1300 resistance area and for buyers to break higher to progress along the uptrend. Refer to the following report “Shinning bright like a diamond” and “30% downside for the USD” for a detailed explanation of our bullish case on Gold. |
| Interesting price action showing up in Gold mining space as well |
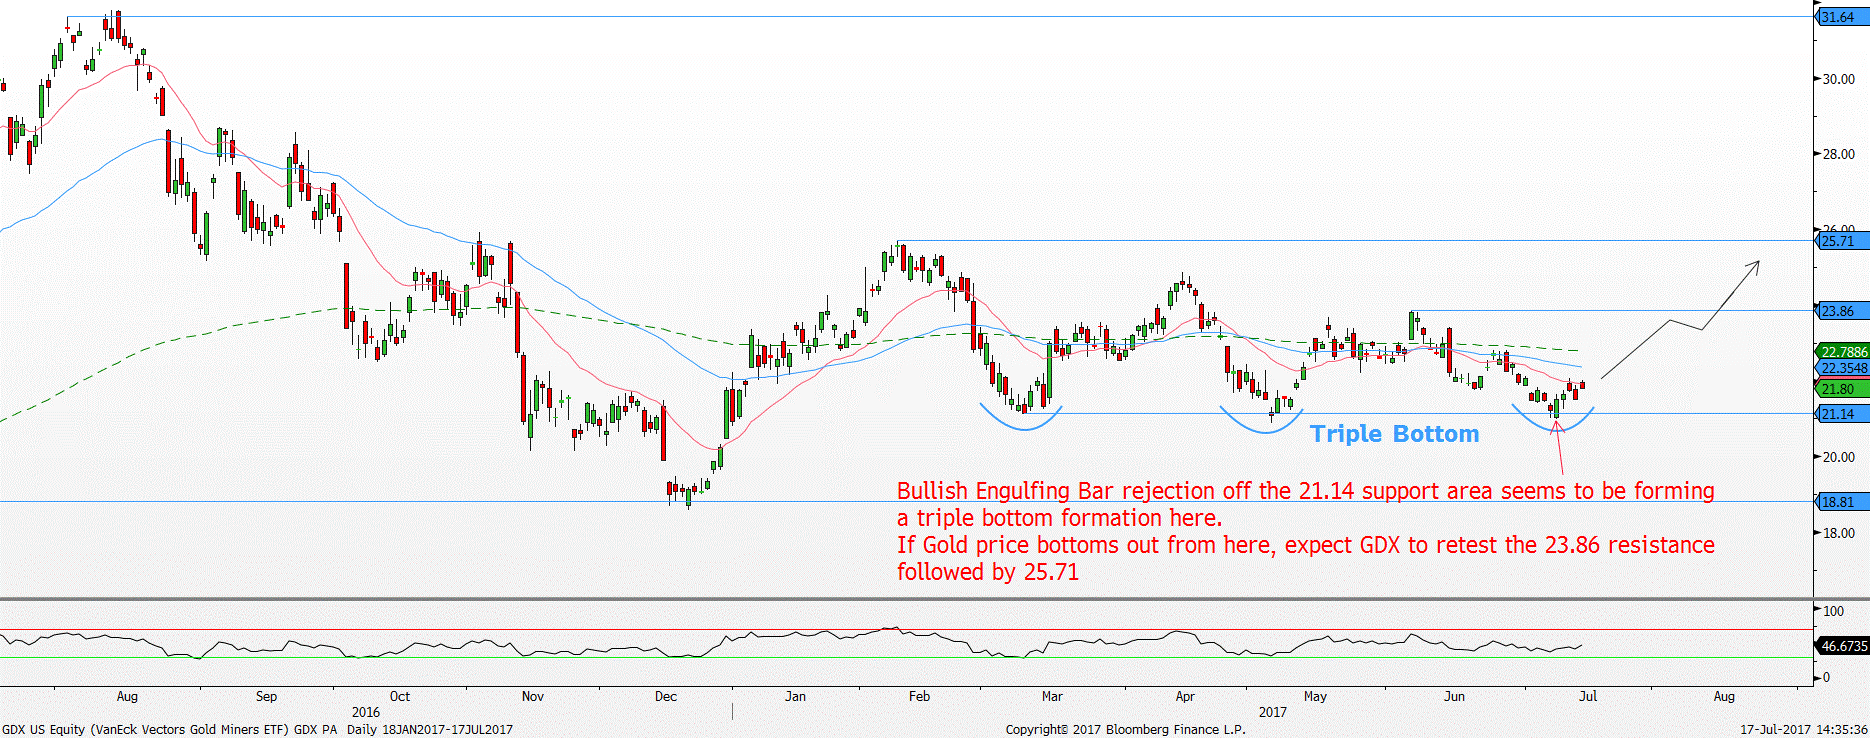
GDX, VanEck Vectors Gold Miners ETF is displaying a triple bottom formation off the $21.14 support area which is in line with the price action in Gold. The Bullish Engulfing Bar rejection off the $21.14 support area on 10 July 2017 was the price action that confirmed the triple bottom formation, and if we expect Gold to take off from here, then the GDX will follow suit with this triple bottom formation to retest the $23.86 resistance area followed by $25.71.
Figure 3. GDX daily chart – Triple bottom formation
Source: Bloomberg
Important Information
This report is prepared and/or distributed by Phillip Securities Research Pte Ltd ("Phillip Securities Research"), which is a holder of a financial adviser’s licence under the Financial Advisers Act, Chapter 110 in Singapore.
By receiving or reading this report, you agree to be bound by the terms and limitations set out below. Any failure to comply with these terms and limitations may constitute a violation of law. This report has been provided to you for personal use only and shall not be reproduced, distributed or published by you in whole or in part, for any purpose. If you have received this report by mistake, please delete or destroy it, and notify the sender immediately.
The information and any analysis, forecasts, projections, expectations and opinions (collectively, the “Research”) contained in this report has been obtained from public sources which Phillip Securities Research believes to be reliable. However, Phillip Securities Research does not make any representation or warranty, express or implied that such information or Research is accurate, complete or appropriate or should be relied upon as such. Any such information or Research contained in this report is subject to change, and Phillip Securities Research shall not have any responsibility to maintain or update the information or Research made available or to supply any corrections, updates or releases in connection therewith.
Any opinions, forecasts, assumptions, estimates, valuations and prices contained in this report are as of the date indicated and are subject to change at any time without prior notice. Past performance of any product referred to in this report is not indicative of future results.
This report does not constitute, and should not be used as a substitute for, tax, legal or investment advice. This report should not be relied upon exclusively or as authoritative, without further being subject to the recipient’s own independent verification and exercise of judgment. The fact that this report has been made available constitutes neither a recommendation to enter into a particular transaction, nor a representation that any product described in this report is suitable or appropriate for the recipient. Recipients should be aware that many of the products, which may be described in this report involve significant risks and may not be suitable for all investors, and that any decision to enter into transactions involving such products should not be made, unless all such risks are understood and an independent determination has been made that such transactions would be appropriate. Any discussion of the risks contained herein with respect to any product should not be considered to be a disclosure of all risks or a complete discussion of such risks.
Nothing in this report shall be construed to be an offer or solicitation for the purchase or sale of any product. Any decision to purchase any product mentioned in this report should take into account existing public information, including any registered prospectus in respect of such product.
Phillip Securities Research, or persons associated with or connected to Phillip Securities Research, including but not limited to its officers, directors, employees or persons involved in the issuance of this report, may provide an array of financial services to a large number of corporations in Singapore and worldwide, including but not limited to commercial / investment banking activities (including sponsorship, financial advisory or underwriting activities), brokerage or securities trading activities. Phillip Securities Research, or persons associated with or connected to Phillip Securities Research, including but not limited to its officers, directors, employees or persons involved in the issuance of this report, may have participated in or invested in transactions with the issuer(s) of the securities mentioned in this report, and may have performed services for or solicited business from such issuers. Additionally, Phillip Securities Research, or persons associated with or connected to Phillip Securities Research, including but not limited to its officers, directors, employees or persons involved in the issuance of this report, may have provided advice or investment services to such companies and investments or related investments, as may be mentioned in this report.
Phillip Securities Research or persons associated with or connected to Phillip Securities Research, including but not limited to its officers, directors, employees or persons involved in the issuance of this report may, from time to time maintain a long or short position in securities referred to herein, or in related futures or options, purchase or sell, make a market in, or engage in any other transaction involving such securities, and earn brokerage or other compensation in respect of the foregoing. Investments will be denominated in various currencies including US dollars and Euro and thus will be subject to any fluctuation in exchange rates between US dollars and Euro or foreign currencies and the currency of your own jurisdiction. Such fluctuations may have an adverse effect on the value, price or income return of the investment.
To the extent permitted by law, Phillip Securities Research, or persons associated with or connected to Phillip Securities Research, including but not limited to its officers, directors, employees or persons involved in the issuance of this report, may at any time engage in any of the above activities as set out above or otherwise hold an interest, whether material or not, in respect of companies and investments or related investments, which may be mentioned in this report. Accordingly, information may be available to Phillip Securities Research, or persons associated with or connected to Phillip Securities Research, including but not limited to its officers, directors, employees or persons involved in the issuance of this report, which is not reflected in this report, and Phillip Securities Research, or persons associated with or connected to Phillip Securities Research, including but not limited to its officers, directors, employees or persons involved in the issuance of this report, may, to the extent permitted by law, have acted upon or used the information prior to or immediately following its publication. Phillip Securities Research, or persons associated with or connected to Phillip Securities Research, including but not limited its officers, directors, employees or persons involved in the issuance of this report, may have issued other material that is inconsistent with, or reach different conclusions from, the contents of this report.
The information, tools and material presented herein are not directed, intended for distribution to or use by, any person or entity in any jurisdiction or country where such distribution, publication, availability or use would be contrary to the applicable law or regulation or which would subject Phillip Securities Research to any registration or licensing or other requirement, or penalty for contravention of such requirements within such jurisdiction.
This report is intended for general circulation only and does not take into account the specific investment objectives, financial situation or particular needs of any particular person. The products mentioned in this report may not be suitable for all investors and a person receiving or reading this report should seek advice from a professional and financial adviser regarding the legal, business, financial, tax and other aspects including the suitability of such products, taking into account the specific investment objectives, financial situation or particular needs of that person, before making a commitment to invest in any of such products.
This report is not intended for distribution, publication to or use by any person in any jurisdiction outside of Singapore or any other jurisdiction as Phillip Securities Research may determine in its absolute discretion.
IMPORTANT DISCLOSURES FOR INCLUDED RESEARCH ANALYSES OR REPORTS OF FOREIGN RESEARCH HOUSE
Where the report contains research analyses or reports from a foreign research house, please note:

Jeremy specialises in Technical Analysis and has 10 years of experience in studying price action. His areas of expertise include intermarket analysis on the equities, currencies, commodities and bonds market.
He is also a regular columnist on The Business Times - every Monday ChartPoint column.
He graduated with a Bachelor of Science in Banking and Finance from University of London.
