
2019 has been a great year for Gold. The precious metal has been on a strong bullish trend in 2019 after a prolonged ranging period from Q4 2015 to Q2 2019. Tracing back the gold movement, the recovery of Gold started in Q1 2016 when prices open at 1061.05 and steadily climbed to 1377.41. Gold had a bear run from September 2011 to 2016 and there are calls that predict Gold may hit below 1000. This is uncalled for as the cost price to manufacture gold is at 1000. Price swiftly reversed above 1046.33 in end December 2015, starting the bull run from 2017 to 2019.
Going forward, Gold surged in 2019 due to the rate cut from the Federal reserves and the gloomy economic outlook. The market heaved a sigh of relief when US and China reached a “phase 1” deal in principle, marking a pause to the trade war that has lasted one and a half years. This resulted in a delay in the December tariff hike.
US GDP expected growth and NFP shows signs of employment rate increase
The US GDP results rose 1.9% in third quarter, beating analysts’ estimates. Analysts believe that the GDP outlook will continue to look bright. Non-farm payroll last month shows a significant increase in jobs by 266,000, beating estimates of 187,000. Which caused the unemployment rate to fall to 3.5%, 0.5% below the natural rate of unemployment in the United States. With a positive economic outlook, the rise of gold prices may stall as yields increase.
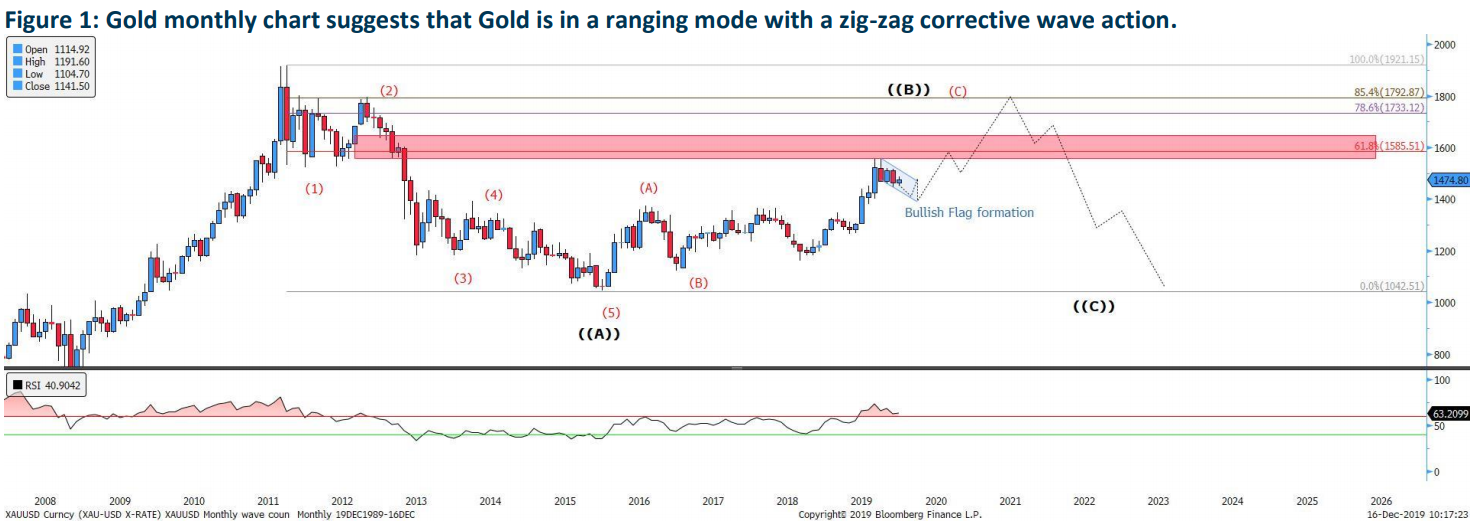
The monthly wave count is forming into a potential zig-zag corrective wave with prices forming a B wave. Based on the monthly chart above, the 5-sub wave count of wave ((A)) has been completed from Q3 2011 – Q4 2015. ((B)) wave has yet to be completed. But some may argue that the ((B)) wave has completed when prices reject the psychological price level of 1550. However, prices still fell short from the minimum 61.8% retracement level of wave ((A)) at 1585.51. In other words, there may be still potential upside towards 1585-1560 level.
Another classic technical pattern is the bullish flag formation, which is a highly probable bullish continuation pattern. In summary, the analysis of the monthly chart gave a clue that gold may have a high possibility of a long-term bull run, possibly beyond 1800.
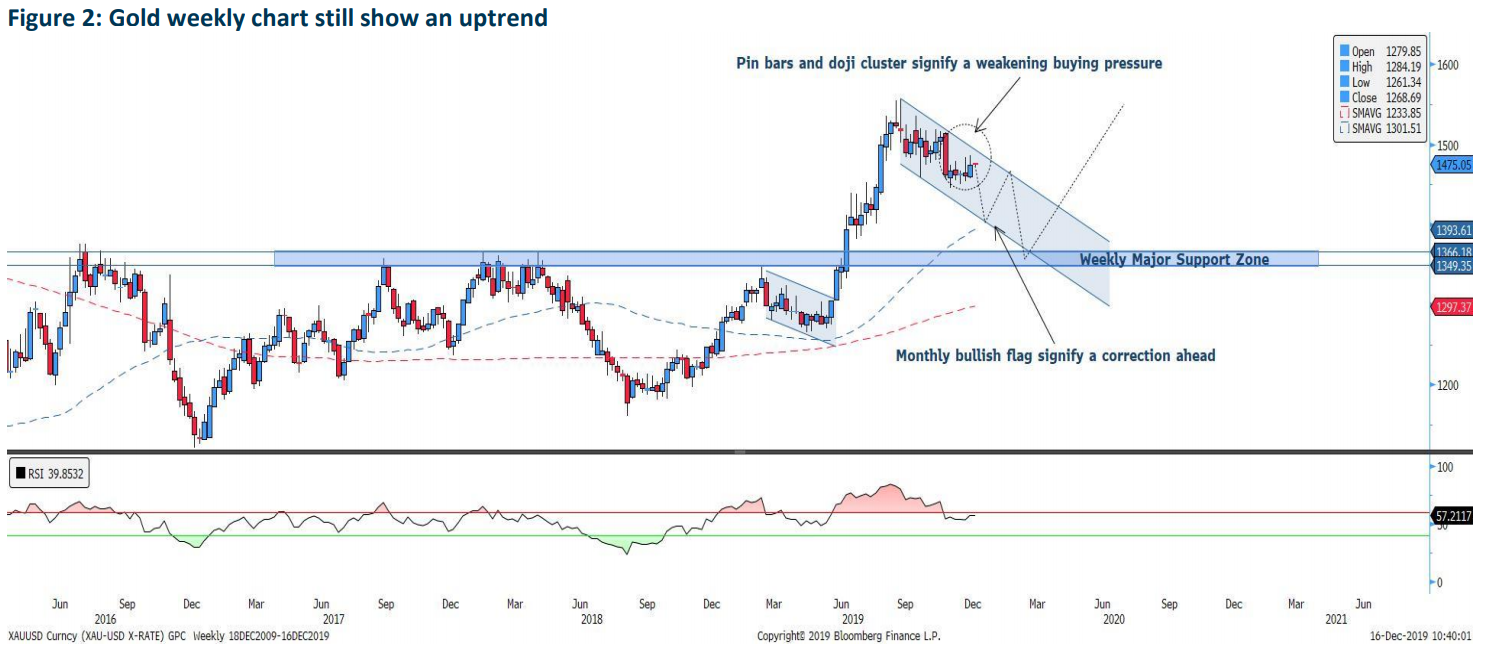
The weekly chart shows a clear uptrend with price trending strongly above both 50 and 200 SMA. However, the recent periods circled shows a cluster of pin bars and dojis. These usually signify that buying momentum is weakening and price may head into a correction towards the weekly major support zone. If we were to analyse the monthly bullish flag, Gold has yet to complete the 2-point base touch, hence a bullish breakout is unlikely in the short term.
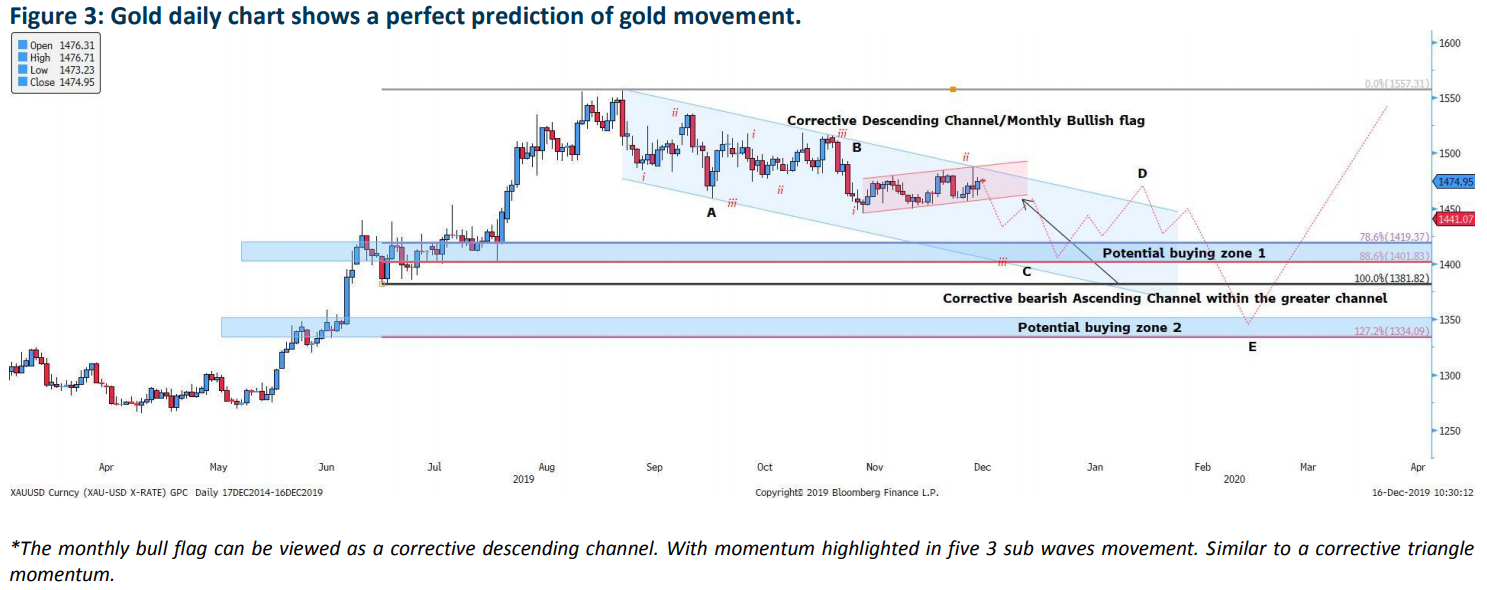
Gold’s daily chart shows a perfect price action movement. The monthly bullish flag pattern is much clearer on the daily chart. Based on the daily chart, there is a sub corrective bearish channel in the ii leg of the C wave. As such we believe that the bearish fall is imminent and prices may decline towards the potential buying zone 1 at 1401.83-1419.37, which is confluent with the 88.6% of the Fibonacci retracement level.
However, the 1401.83 region may not be the best buying zone. Firstly, there may be a movement through to wave D unless 1450 resistance level is broken. Secondly, the corrective channel is a 5-wave structure movement. It is highly unlikely that there will be a strong bull run at buying zone 1 before wave E is formed. Thirdly, prices closed at the resistance level of 1483.37 on 9th and 12th December respectively and there may be a potential double top formation.
In summary, we may see a drop in gold prices in 1H 2020 before a greater rally in 2H 2020.
Important Information
This report is prepared and/or distributed by Phillip Securities Research Pte Ltd ("Phillip Securities Research"), which is a holder of a financial adviser’s licence under the Financial Advisers Act, Chapter 110 in Singapore.
By receiving or reading this report, you agree to be bound by the terms and limitations set out below. Any failure to comply with these terms and limitations may constitute a violation of law. This report has been provided to you for personal use only and shall not be reproduced, distributed or published by you in whole or in part, for any purpose. If you have received this report by mistake, please delete or destroy it, and notify the sender immediately.
The information and any analysis, forecasts, projections, expectations and opinions (collectively, the “Research”) contained in this report has been obtained from public sources which Phillip Securities Research believes to be reliable. However, Phillip Securities Research does not make any representation or warranty, express or implied that such information or Research is accurate, complete or appropriate or should be relied upon as such. Any such information or Research contained in this report is subject to change, and Phillip Securities Research shall not have any responsibility to maintain or update the information or Research made available or to supply any corrections, updates or releases in connection therewith.
Any opinions, forecasts, assumptions, estimates, valuations and prices contained in this report are as of the date indicated and are subject to change at any time without prior notice. Past performance of any product referred to in this report is not indicative of future results.
This report does not constitute, and should not be used as a substitute for, tax, legal or investment advice. This report should not be relied upon exclusively or as authoritative, without further being subject to the recipient’s own independent verification and exercise of judgment. The fact that this report has been made available constitutes neither a recommendation to enter into a particular transaction, nor a representation that any product described in this report is suitable or appropriate for the recipient. Recipients should be aware that many of the products, which may be described in this report involve significant risks and may not be suitable for all investors, and that any decision to enter into transactions involving such products should not be made, unless all such risks are understood and an independent determination has been made that such transactions would be appropriate. Any discussion of the risks contained herein with respect to any product should not be considered to be a disclosure of all risks or a complete discussion of such risks.
Nothing in this report shall be construed to be an offer or solicitation for the purchase or sale of any product. Any decision to purchase any product mentioned in this report should take into account existing public information, including any registered prospectus in respect of such product.
Phillip Securities Research, or persons associated with or connected to Phillip Securities Research, including but not limited to its officers, directors, employees or persons involved in the issuance of this report, may provide an array of financial services to a large number of corporations in Singapore and worldwide, including but not limited to commercial / investment banking activities (including sponsorship, financial advisory or underwriting activities), brokerage or securities trading activities. Phillip Securities Research, or persons associated with or connected to Phillip Securities Research, including but not limited to its officers, directors, employees or persons involved in the issuance of this report, may have participated in or invested in transactions with the issuer(s) of the securities mentioned in this report, and may have performed services for or solicited business from such issuers. Additionally, Phillip Securities Research, or persons associated with or connected to Phillip Securities Research, including but not limited to its officers, directors, employees or persons involved in the issuance of this report, may have provided advice or investment services to such companies and investments or related investments, as may be mentioned in this report.
Phillip Securities Research or persons associated with or connected to Phillip Securities Research, including but not limited to its officers, directors, employees or persons involved in the issuance of this report may, from time to time maintain a long or short position in securities referred to herein, or in related futures or options, purchase or sell, make a market in, or engage in any other transaction involving such securities, and earn brokerage or other compensation in respect of the foregoing. Investments will be denominated in various currencies including US dollars and Euro and thus will be subject to any fluctuation in exchange rates between US dollars and Euro or foreign currencies and the currency of your own jurisdiction. Such fluctuations may have an adverse effect on the value, price or income return of the investment.
To the extent permitted by law, Phillip Securities Research, or persons associated with or connected to Phillip Securities Research, including but not limited to its officers, directors, employees or persons involved in the issuance of this report, may at any time engage in any of the above activities as set out above or otherwise hold an interest, whether material or not, in respect of companies and investments or related investments, which may be mentioned in this report. Accordingly, information may be available to Phillip Securities Research, or persons associated with or connected to Phillip Securities Research, including but not limited to its officers, directors, employees or persons involved in the issuance of this report, which is not reflected in this report, and Phillip Securities Research, or persons associated with or connected to Phillip Securities Research, including but not limited to its officers, directors, employees or persons involved in the issuance of this report, may, to the extent permitted by law, have acted upon or used the information prior to or immediately following its publication. Phillip Securities Research, or persons associated with or connected to Phillip Securities Research, including but not limited its officers, directors, employees or persons involved in the issuance of this report, may have issued other material that is inconsistent with, or reach different conclusions from, the contents of this report.
The information, tools and material presented herein are not directed, intended for distribution to or use by, any person or entity in any jurisdiction or country where such distribution, publication, availability or use would be contrary to the applicable law or regulation or which would subject Phillip Securities Research to any registration or licensing or other requirement, or penalty for contravention of such requirements within such jurisdiction.
This report is intended for general circulation only and does not take into account the specific investment objectives, financial situation or particular needs of any particular person. The products mentioned in this report may not be suitable for all investors and a person receiving or reading this report should seek advice from a professional and financial adviser regarding the legal, business, financial, tax and other aspects including the suitability of such products, taking into account the specific investment objectives, financial situation or particular needs of that person, before making a commitment to invest in any of such products.
This report is not intended for distribution, publication to or use by any person in any jurisdiction outside of Singapore or any other jurisdiction as Phillip Securities Research may determine in its absolute discretion.
IMPORTANT DISCLOSURES FOR INCLUDED RESEARCH ANALYSES OR REPORTS OF FOREIGN RESEARCH HOUSE
Where the report contains research analyses or reports from a foreign research house, please note:
