
2019 has been a great year for Gold. The precious metal had a bullish rally in 2019 after a flat performance from 4Q15 to 3Q19. Gold was in a downtrend from September 2011 to 4Q15. There were predictions for Gold to hit below 1000. However, prices were well supported at 1046.33. Gold began to recover from 4Q15 when prices opened at 1061.05 and eventually broke out of its range at 1377.41 in 3Q19. It has rallied since to 1611.50.
On the other hand, the dollar index has been performing poorly from Q32019 when the index peaked at 99.60, 0.40 points short to reach the 100.00 target level. This signifies that the dollar is actually overheated and with the 3 rates cut in 2019, the dollar was looking for a sell down.
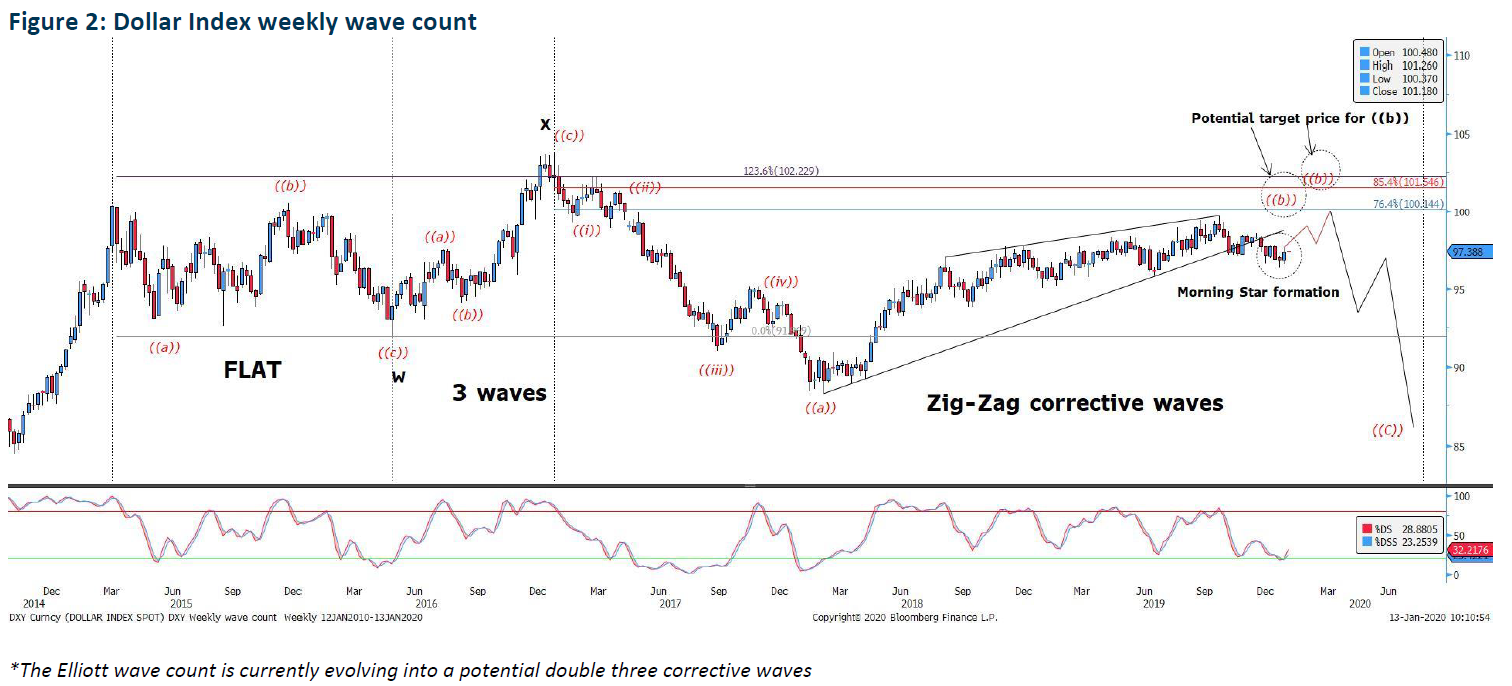
The weekly wave count, in a nutshell, has completed almost 80% of the total double three corrective waves with the ((b)) wave on its way to completion. The index indicates that the dollar index will have a up move to complete the ((b)) wave despite a breakdown of the rising wedge formation as classic technical price action suggest that the morning star formation may be the key to an upward reversal. However, the rally is limited and will reverse to a downward 5 sub-wave move of the ((c)) wave leg. There are currently two targets for the ((b)) wave. 100.14 and 101.54 which lies on the 75.4% and 85.4% of the Fibonacci retracement level of wave X.
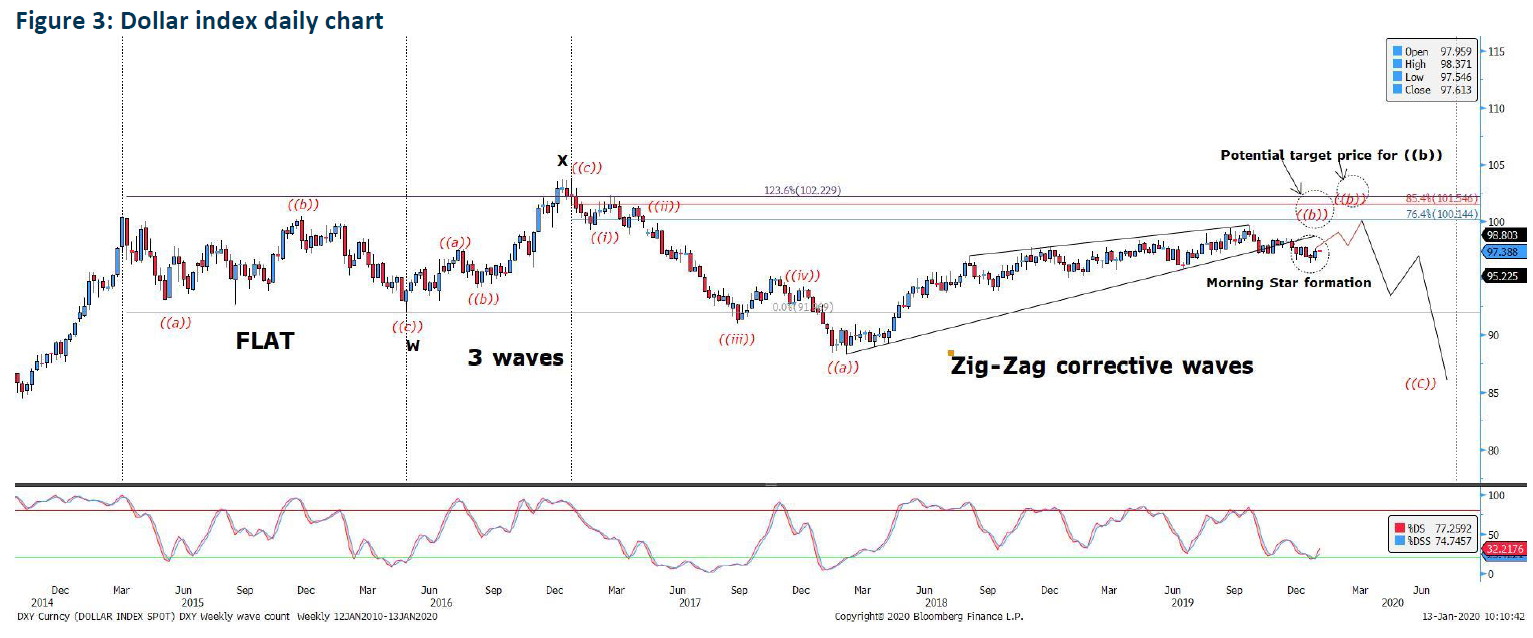
The daily chart shows a clearer move of the upside rally in which there are two reversal patterns highlighted. First, the greater falling wedge from Oct 2019 to Jan 2020 has yet to be broken but the smaller falling wedge formation indicates a sign of a false breakout. The first price forms a shooting star on Friday close below the resistance zone. Second, the bullish momentum for the past 4 periods is shrinking with the 2nd period candle broking past 97.00. However, the third candle highlighted a slowing momentum near the resistance zone.
As such, there might be a further downside before a rally occurs. The ideal rebound price will be at 96.92 regions.
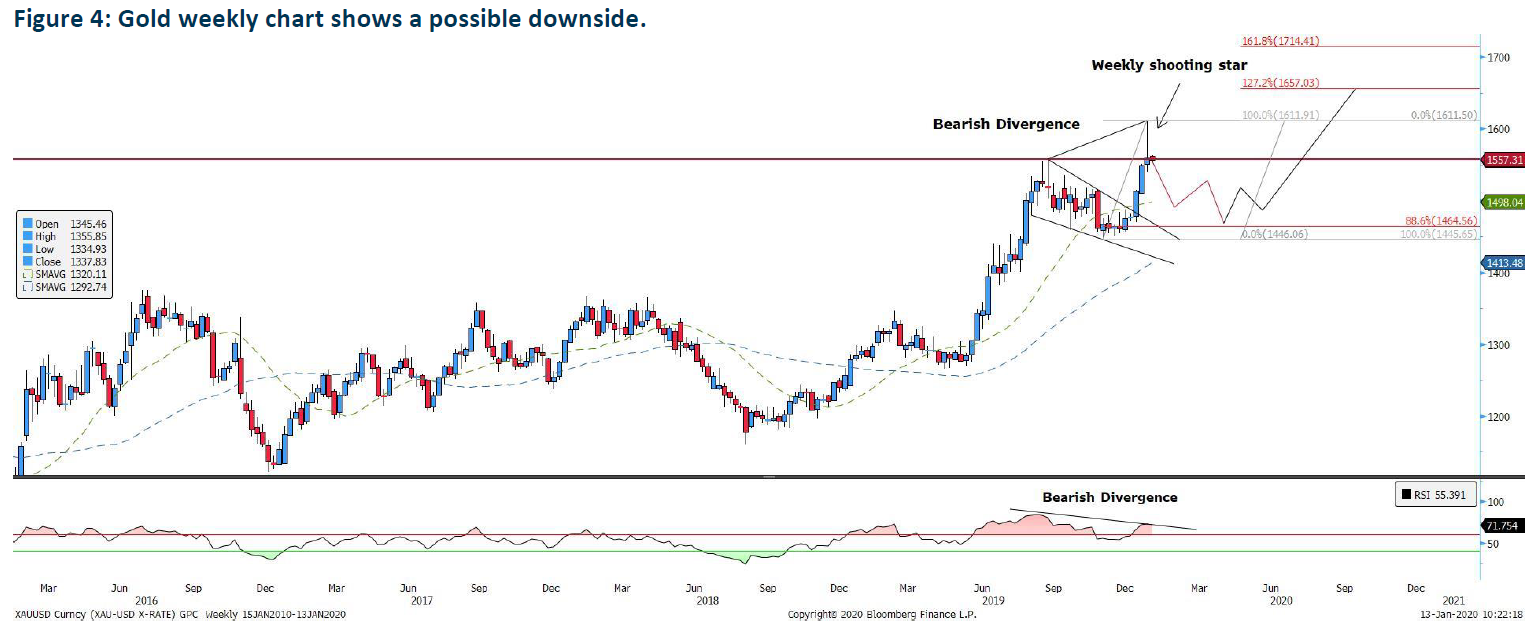
Gold’s weekly chart saw a good start to 2020 when it bashed through the corrective wedge top and reach the target of 1611.50. However, gold had a weak finish in the 2nd half of the week and closed off the week with a shooting star. Also, prices returned to near the support area at 1557.31, which may cause the prices of gold to drop below the support level, turning the support into resistance. On the indicator front, the bearish divergence signifies that there will be more potential downside of gold. As such, we may see gold ranging between 1464.56 to 1557.31 in the next few months.
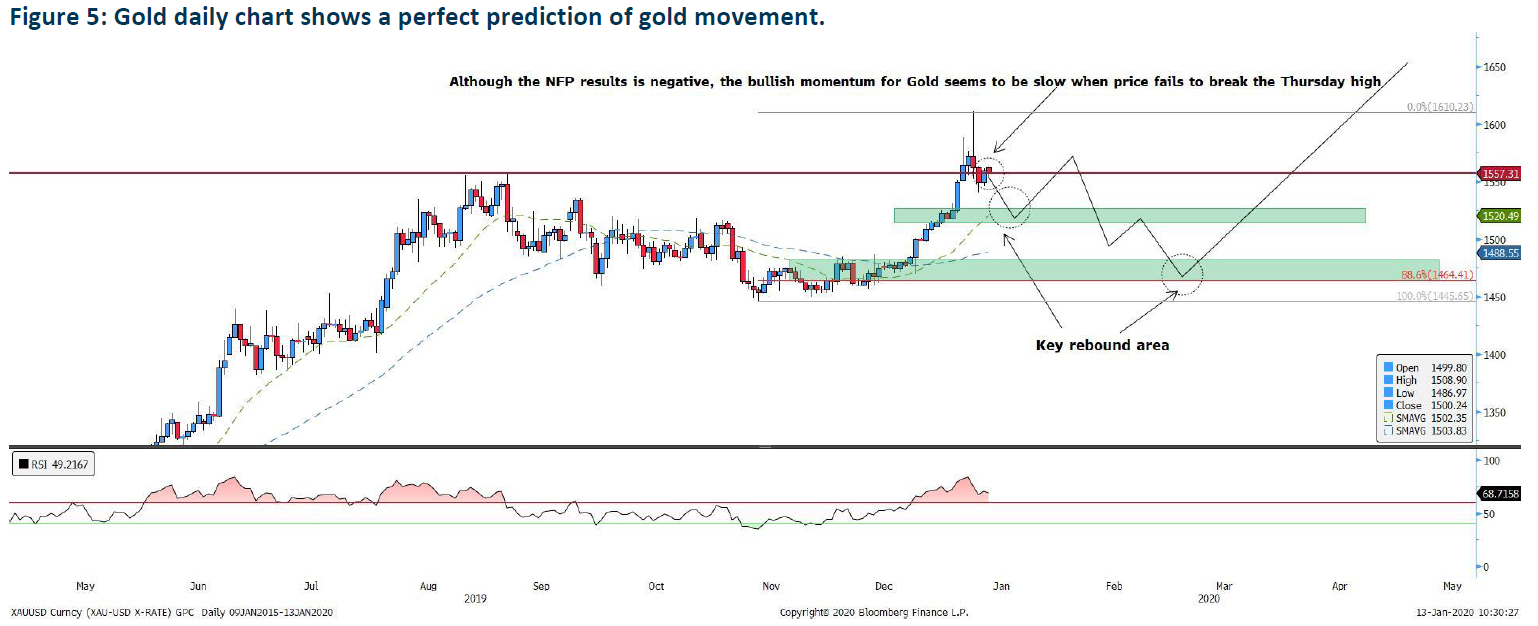
Despite a weaker than expected Non-farm payroll result, the bullish move on Friday for Gold, it did not break the Thursday high at 1563.50. This signifies that Gold is considered overbought and may correct further into the key rebound area for a few months. As such, Gold prices may enter into a ranging phase with an ideal and possible strong rally at 1466.90, which confluence with the 88.6% of the deep retracement of 1488.26-1611.79.
There is a strong possibility that Gold may have a continued strong rally like what was mentioned on the weekly chart. However, several conditions need to be met. The first condition is that prices must break the 1580 psychological level within a week. Secondly, the price must stay above 1580 for at least 2 daily periods within a week.
Summary
The dollar index is pointing towards a short-term rally while Gold is showing signs of a bearish correction. No doubt gold will hit the long-term target of 1800.00 in time to come, the technical sentiment presented may find Gold in a corrective phase while the dollar is soaring in the near-term. With the dollar strengthening in the 2nd half of January 2020, there is no doubt that gold may be heading into a corrective ranging phase with a possible regular flat in the making.
Important Information
This report is prepared and/or distributed by Phillip Securities Research Pte Ltd ("Phillip Securities Research"), which is a holder of a financial adviser’s licence under the Financial Advisers Act, Chapter 110 in Singapore.
By receiving or reading this report, you agree to be bound by the terms and limitations set out below. Any failure to comply with these terms and limitations may constitute a violation of law. This report has been provided to you for personal use only and shall not be reproduced, distributed or published by you in whole or in part, for any purpose. If you have received this report by mistake, please delete or destroy it, and notify the sender immediately.
The information and any analysis, forecasts, projections, expectations and opinions (collectively, the “Research”) contained in this report has been obtained from public sources which Phillip Securities Research believes to be reliable. However, Phillip Securities Research does not make any representation or warranty, express or implied that such information or Research is accurate, complete or appropriate or should be relied upon as such. Any such information or Research contained in this report is subject to change, and Phillip Securities Research shall not have any responsibility to maintain or update the information or Research made available or to supply any corrections, updates or releases in connection therewith.
Any opinions, forecasts, assumptions, estimates, valuations and prices contained in this report are as of the date indicated and are subject to change at any time without prior notice. Past performance of any product referred to in this report is not indicative of future results.
This report does not constitute, and should not be used as a substitute for, tax, legal or investment advice. This report should not be relied upon exclusively or as authoritative, without further being subject to the recipient’s own independent verification and exercise of judgment. The fact that this report has been made available constitutes neither a recommendation to enter into a particular transaction, nor a representation that any product described in this report is suitable or appropriate for the recipient. Recipients should be aware that many of the products, which may be described in this report involve significant risks and may not be suitable for all investors, and that any decision to enter into transactions involving such products should not be made, unless all such risks are understood and an independent determination has been made that such transactions would be appropriate. Any discussion of the risks contained herein with respect to any product should not be considered to be a disclosure of all risks or a complete discussion of such risks.
Nothing in this report shall be construed to be an offer or solicitation for the purchase or sale of any product. Any decision to purchase any product mentioned in this report should take into account existing public information, including any registered prospectus in respect of such product.
Phillip Securities Research, or persons associated with or connected to Phillip Securities Research, including but not limited to its officers, directors, employees or persons involved in the issuance of this report, may provide an array of financial services to a large number of corporations in Singapore and worldwide, including but not limited to commercial / investment banking activities (including sponsorship, financial advisory or underwriting activities), brokerage or securities trading activities. Phillip Securities Research, or persons associated with or connected to Phillip Securities Research, including but not limited to its officers, directors, employees or persons involved in the issuance of this report, may have participated in or invested in transactions with the issuer(s) of the securities mentioned in this report, and may have performed services for or solicited business from such issuers. Additionally, Phillip Securities Research, or persons associated with or connected to Phillip Securities Research, including but not limited to its officers, directors, employees or persons involved in the issuance of this report, may have provided advice or investment services to such companies and investments or related investments, as may be mentioned in this report.
Phillip Securities Research or persons associated with or connected to Phillip Securities Research, including but not limited to its officers, directors, employees or persons involved in the issuance of this report may, from time to time maintain a long or short position in securities referred to herein, or in related futures or options, purchase or sell, make a market in, or engage in any other transaction involving such securities, and earn brokerage or other compensation in respect of the foregoing. Investments will be denominated in various currencies including US dollars and Euro and thus will be subject to any fluctuation in exchange rates between US dollars and Euro or foreign currencies and the currency of your own jurisdiction. Such fluctuations may have an adverse effect on the value, price or income return of the investment.
To the extent permitted by law, Phillip Securities Research, or persons associated with or connected to Phillip Securities Research, including but not limited to its officers, directors, employees or persons involved in the issuance of this report, may at any time engage in any of the above activities as set out above or otherwise hold an interest, whether material or not, in respect of companies and investments or related investments, which may be mentioned in this report. Accordingly, information may be available to Phillip Securities Research, or persons associated with or connected to Phillip Securities Research, including but not limited to its officers, directors, employees or persons involved in the issuance of this report, which is not reflected in this report, and Phillip Securities Research, or persons associated with or connected to Phillip Securities Research, including but not limited to its officers, directors, employees or persons involved in the issuance of this report, may, to the extent permitted by law, have acted upon or used the information prior to or immediately following its publication. Phillip Securities Research, or persons associated with or connected to Phillip Securities Research, including but not limited its officers, directors, employees or persons involved in the issuance of this report, may have issued other material that is inconsistent with, or reach different conclusions from, the contents of this report.
The information, tools and material presented herein are not directed, intended for distribution to or use by, any person or entity in any jurisdiction or country where such distribution, publication, availability or use would be contrary to the applicable law or regulation or which would subject Phillip Securities Research to any registration or licensing or other requirement, or penalty for contravention of such requirements within such jurisdiction.
This report is intended for general circulation only and does not take into account the specific investment objectives, financial situation or particular needs of any particular person. The products mentioned in this report may not be suitable for all investors and a person receiving or reading this report should seek advice from a professional and financial adviser regarding the legal, business, financial, tax and other aspects including the suitability of such products, taking into account the specific investment objectives, financial situation or particular needs of that person, before making a commitment to invest in any of such products.
This report is not intended for distribution, publication to or use by any person in any jurisdiction outside of Singapore or any other jurisdiction as Phillip Securities Research may determine in its absolute discretion.
IMPORTANT DISCLOSURES FOR INCLUDED RESEARCH ANALYSES OR REPORTS OF FOREIGN RESEARCH HOUSE
Where the report contains research analyses or reports from a foreign research house, please note:
