
This article was published on Business Times’ column “ChartPoint” on 18 September 2017.
STI Weekly chart Source: Bloomberg, PSR
After a week’s break from missile test on 3 September, North Korea did it again. It tested an intermediate range ballistic missile that flew over Japan on 15 September 2017, causing the general market to remain depressed especially the Straits Times Index (STI).
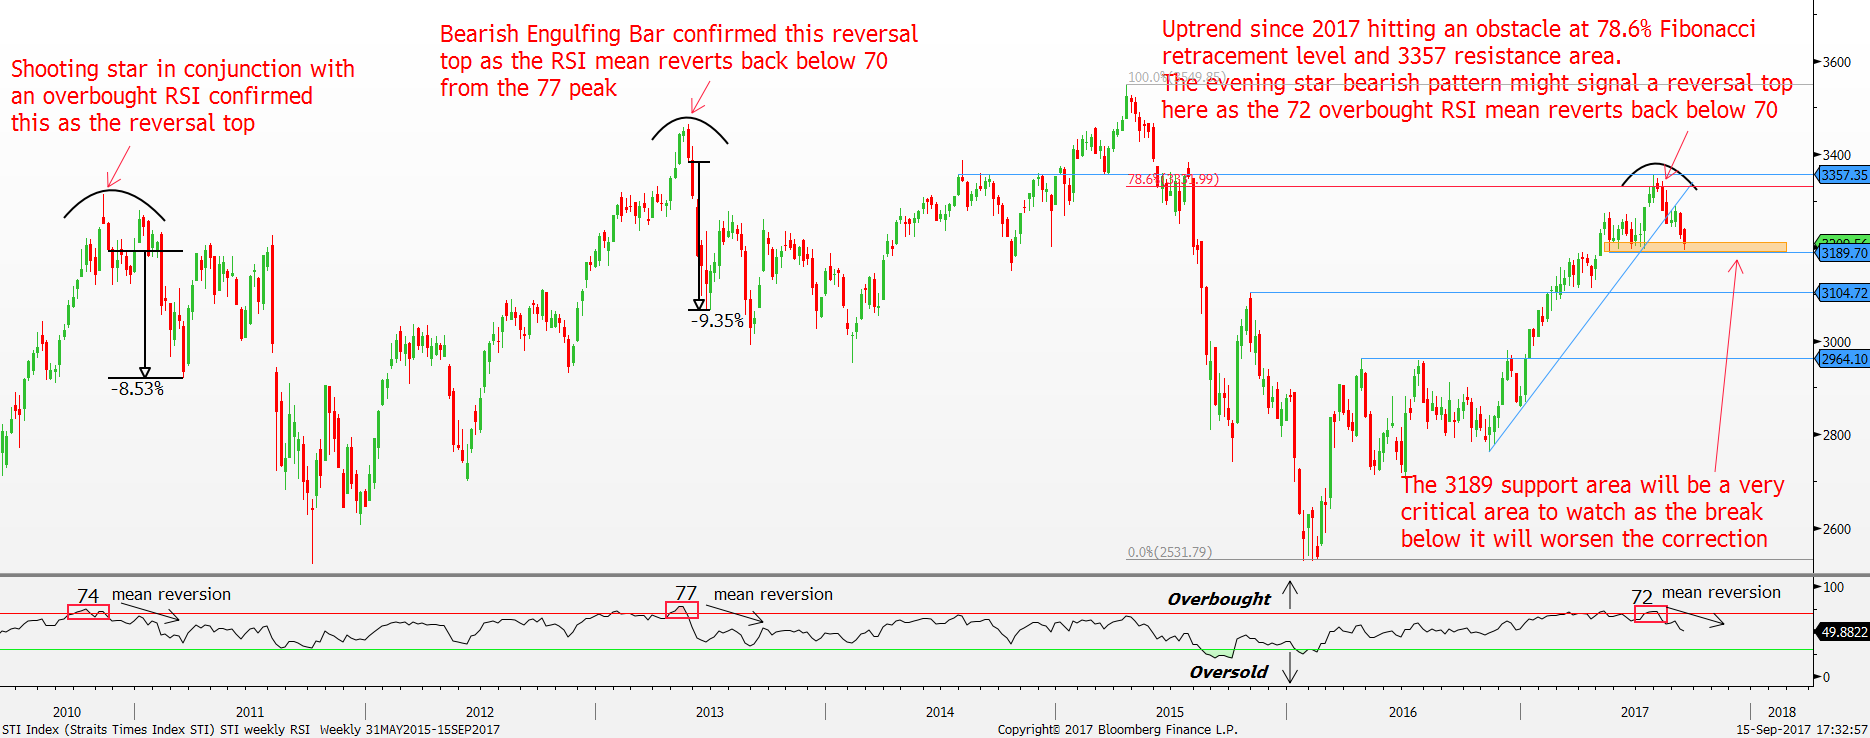
The bullish momentum in the STI only began accelerating since the start of 2017 after the STI broke above the 2964 resistance area. Since then, the bullish momentum raged on until recently in July 2017 where some weakness appeared. The confluence of 78.6% Fibonacci retracement level and 3357 resistance area seemed to be causing some obstacle for the bulls as the STI failed to break above it. Moreover, the rally since the start of the year has resulted in the Relative Strength Index (RSI) entering into overbought territory in July implying a high possibility of a deeper correction.
Relative Strength Index (RSI) provide a reliable signal to spot for reversal point when the RSI is at either extreme. An RSI reading above 70 shows overbought conditions where a reversal to the downside is expected while an RSI reading below 30 highlights oversold conditions where a reversal to the upside is expected.
Things to look out for in a reversal with an overbought RSI:
An overbought RSI works best in conjunction with bearish price action to confirm the reversal point. For instance, in the week ended 22 March 2013, that was when the RSI first proceeded into the overbought condition at 70 signalling danger ahead. The reversal top only came in four weeks later after a Bearish Engulfing Bar confirmed the mean reversion in RSI is taking place as the RSI dipped back below 70. As a result, the STI fell 9% subsequently in the following four weeks.
Another good example to showcase the overbought RSI happened in the November 2010. In the week ended 5 November 2010, the RSI re-entered into the overbought territory signaling a top is near. One week later, a shooting star formed which happened to be the reversal top. The confirmation of the correction came another week later after the RSI fell back below the 70 overbought region to confirm the mean reversion property as the STI fell 8.5% subsequently.
In total, there were 14 RSI overbought signals generated since 1995. Out of the 14 signals, only three failed to signal a significant reversal in July 1999, February 2005 and August 2009. The average correction from the confirmation of the mean reversion is – 7.7% and the largest drawdown happened in January 2000 where the STI fell 23% after the overbought RSI signal was triggered.
With the recent rally since the start of 2017, the RSI has fulfilled the overbought criteria again since March 2017 and more recently in July 2017 where the RSI hit an extreme high of 72.6. Since then, some bearish price action began appearing with the formation of an evening star bearish pattern in the week ended 11 August 2017. Moreover, the bearish price action has also led the RSI to mean revert back below the 70 overbought region implying a deeper correction is about to happen. A further sign of weakness can be seen by the bearish break of the uptrend line since November 2016 in the week ended 18 August 2017.
If the overbought RSI signal holds, we believe the STI is in the midst of a correction phase with the reversal top formed in the week ended 28 July 2017 at 3354 high. The key area to watch currently is the 3189 support area. That area held the STI up relentlessly since May 2017. If the STI was to break below the 3189 support area, we believe the current correction will get more severe as the STI search out for the next support area at 3114 followed by 3000.
Important Information
This report is prepared and/or distributed by Phillip Securities Research Pte Ltd ("Phillip Securities Research"), which is a holder of a financial adviser’s licence under the Financial Advisers Act, Chapter 110 in Singapore.
By receiving or reading this report, you agree to be bound by the terms and limitations set out below. Any failure to comply with these terms and limitations may constitute a violation of law. This report has been provided to you for personal use only and shall not be reproduced, distributed or published by you in whole or in part, for any purpose. If you have received this report by mistake, please delete or destroy it, and notify the sender immediately.
The information and any analysis, forecasts, projections, expectations and opinions (collectively, the “Research”) contained in this report has been obtained from public sources which Phillip Securities Research believes to be reliable. However, Phillip Securities Research does not make any representation or warranty, express or implied that such information or Research is accurate, complete or appropriate or should be relied upon as such. Any such information or Research contained in this report is subject to change, and Phillip Securities Research shall not have any responsibility to maintain or update the information or Research made available or to supply any corrections, updates or releases in connection therewith.
Any opinions, forecasts, assumptions, estimates, valuations and prices contained in this report are as of the date indicated and are subject to change at any time without prior notice. Past performance of any product referred to in this report is not indicative of future results.
This report does not constitute, and should not be used as a substitute for, tax, legal or investment advice. This report should not be relied upon exclusively or as authoritative, without further being subject to the recipient’s own independent verification and exercise of judgment. The fact that this report has been made available constitutes neither a recommendation to enter into a particular transaction, nor a representation that any product described in this report is suitable or appropriate for the recipient. Recipients should be aware that many of the products, which may be described in this report involve significant risks and may not be suitable for all investors, and that any decision to enter into transactions involving such products should not be made, unless all such risks are understood and an independent determination has been made that such transactions would be appropriate. Any discussion of the risks contained herein with respect to any product should not be considered to be a disclosure of all risks or a complete discussion of such risks.
Nothing in this report shall be construed to be an offer or solicitation for the purchase or sale of any product. Any decision to purchase any product mentioned in this report should take into account existing public information, including any registered prospectus in respect of such product.
Phillip Securities Research, or persons associated with or connected to Phillip Securities Research, including but not limited to its officers, directors, employees or persons involved in the issuance of this report, may provide an array of financial services to a large number of corporations in Singapore and worldwide, including but not limited to commercial / investment banking activities (including sponsorship, financial advisory or underwriting activities), brokerage or securities trading activities. Phillip Securities Research, or persons associated with or connected to Phillip Securities Research, including but not limited to its officers, directors, employees or persons involved in the issuance of this report, may have participated in or invested in transactions with the issuer(s) of the securities mentioned in this report, and may have performed services for or solicited business from such issuers. Additionally, Phillip Securities Research, or persons associated with or connected to Phillip Securities Research, including but not limited to its officers, directors, employees or persons involved in the issuance of this report, may have provided advice or investment services to such companies and investments or related investments, as may be mentioned in this report.
Phillip Securities Research or persons associated with or connected to Phillip Securities Research, including but not limited to its officers, directors, employees or persons involved in the issuance of this report may, from time to time maintain a long or short position in securities referred to herein, or in related futures or options, purchase or sell, make a market in, or engage in any other transaction involving such securities, and earn brokerage or other compensation in respect of the foregoing. Investments will be denominated in various currencies including US dollars and Euro and thus will be subject to any fluctuation in exchange rates between US dollars and Euro or foreign currencies and the currency of your own jurisdiction. Such fluctuations may have an adverse effect on the value, price or income return of the investment.
To the extent permitted by law, Phillip Securities Research, or persons associated with or connected to Phillip Securities Research, including but not limited to its officers, directors, employees or persons involved in the issuance of this report, may at any time engage in any of the above activities as set out above or otherwise hold an interest, whether material or not, in respect of companies and investments or related investments, which may be mentioned in this report. Accordingly, information may be available to Phillip Securities Research, or persons associated with or connected to Phillip Securities Research, including but not limited to its officers, directors, employees or persons involved in the issuance of this report, which is not reflected in this report, and Phillip Securities Research, or persons associated with or connected to Phillip Securities Research, including but not limited to its officers, directors, employees or persons involved in the issuance of this report, may, to the extent permitted by law, have acted upon or used the information prior to or immediately following its publication. Phillip Securities Research, or persons associated with or connected to Phillip Securities Research, including but not limited its officers, directors, employees or persons involved in the issuance of this report, may have issued other material that is inconsistent with, or reach different conclusions from, the contents of this report.
The information, tools and material presented herein are not directed, intended for distribution to or use by, any person or entity in any jurisdiction or country where such distribution, publication, availability or use would be contrary to the applicable law or regulation or which would subject Phillip Securities Research to any registration or licensing or other requirement, or penalty for contravention of such requirements within such jurisdiction.
This report is intended for general circulation only and does not take into account the specific investment objectives, financial situation or particular needs of any particular person. The products mentioned in this report may not be suitable for all investors and a person receiving or reading this report should seek advice from a professional and financial adviser regarding the legal, business, financial, tax and other aspects including the suitability of such products, taking into account the specific investment objectives, financial situation or particular needs of that person, before making a commitment to invest in any of such products.
This report is not intended for distribution, publication to or use by any person in any jurisdiction outside of Singapore or any other jurisdiction as Phillip Securities Research may determine in its absolute discretion.
IMPORTANT DISCLOSURES FOR INCLUDED RESEARCH ANALYSES OR REPORTS OF FOREIGN RESEARCH HOUSE
Where the report contains research analyses or reports from a foreign research house, please note:

Jeremy specialises in Technical Analysis and has 10 years of experience in studying price action. His areas of expertise include intermarket analysis on the equities, currencies, commodities and bonds market.
He is also a regular columnist on The Business Times - every Monday ChartPoint column.
He graduated with a Bachelor of Science in Banking and Finance from University of London.
