
This article was published in Business Times’ column “Chart Point” on 10 September 2018.
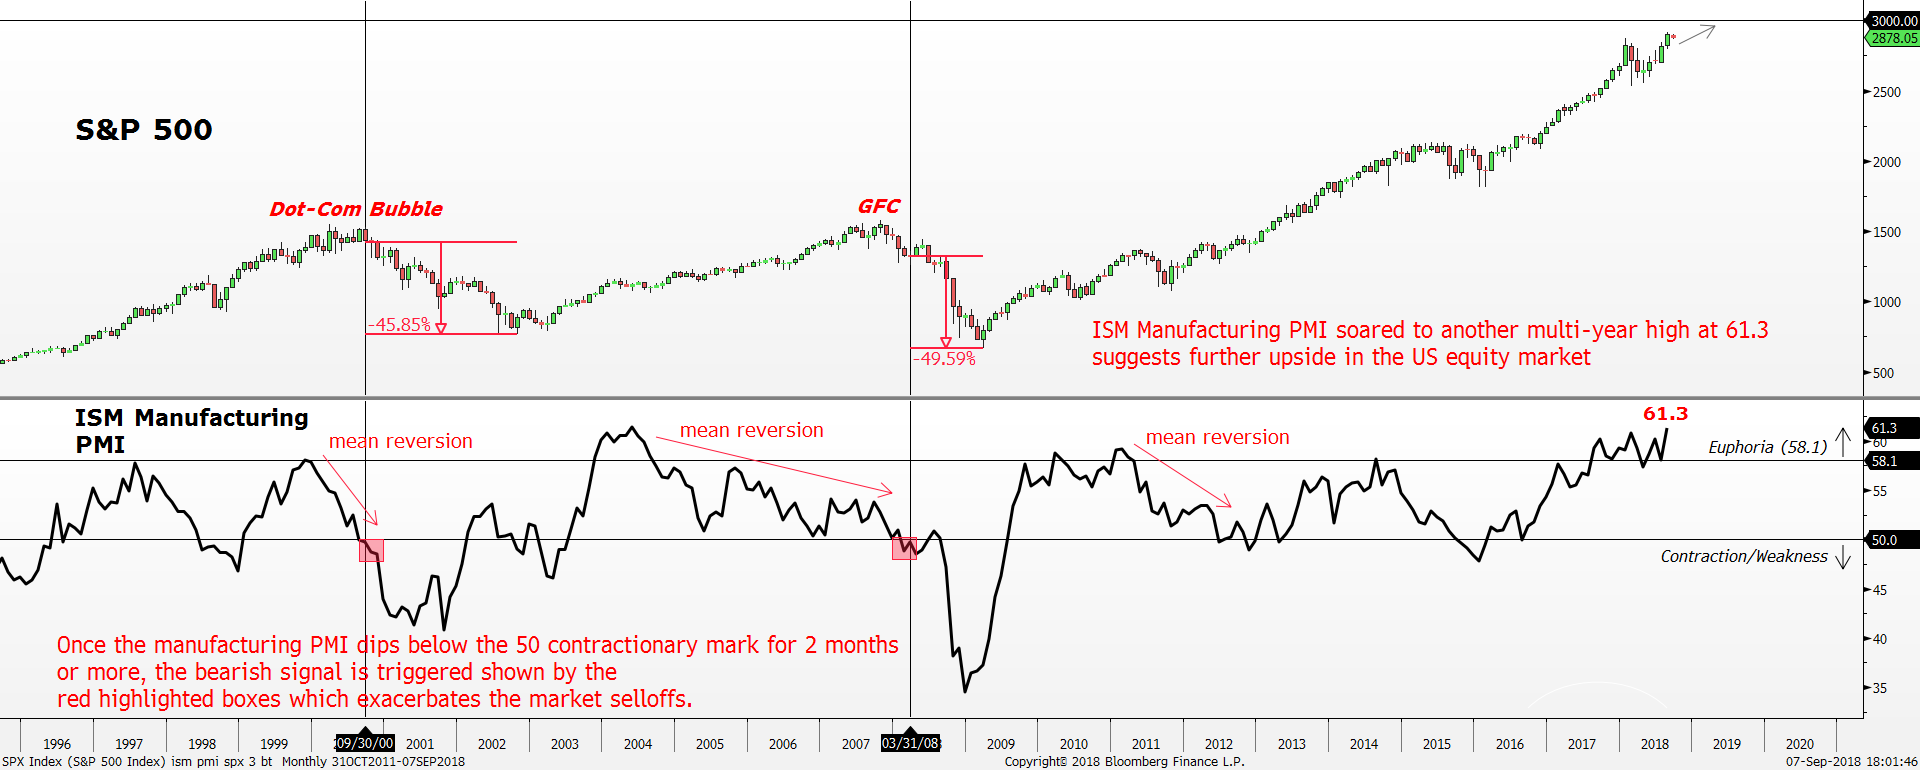
S&P 500 vs ISM Manufacturing PMI Monthly Timeframe Source: Bloomberg, PSR
*Vertical lines demarcate the point where the ISM Manufacturing PMI contracted for two consecutive months leading to the market selloff
Despite the ongoing trade tension between the US and China over tariffs on $200 billion worth of Chinese imports, the US economic data and sentiment indicators remain strong. The uncertainty from the trade tension does not seem to be affecting the overall sentiment of manufacturers in the US. Instead, the ISM Manufacturing Purchasing Managers Index (PMI) continued to soar in August, hitting a noteworthy high of 61.3, a reflection of an extremely optimistic view of the economy. To put things into context, this is the highest level since 1984.
ISM Manufacturing PMI is a leading indicator that is based on surveys of more than 300 manufacturing firms by the Institute for Supply Management (ISM). A reading above 50 indicates expanding economic activity while a reading below 50 indicates a contraction in economic activity. The PMI monitors employment, production, inventories, new orders and supplier deliveries.
Historically, there is a very strong positive correlation between the ISM Manufacturing PMI and the S&P 500 index. As long as the PMI is expanding and improving above 50, the S&P 500 index tends to move alongside in the uptrend.
On the other hand, the end of the equity bull market is usually signalled by a contraction in the PMI. Our study shows a contraction below 50 of at least two consecutive months is needed for the confirmation of the end of the bull run in the equity market. For example, both the Dot-Com Bubble and Global Financial Crisis (GFC) market tops were both signalled by the contraction in the ISM Manufacturing PMI shown by the highlighted boxes. As soon as the ISM Manufacturing PMI falls below 50 for two consecutive months signalling an economic contraction, the top in S&P 500 index was established. The S&P 500 index then plummeted around -45% and -49% respectively. Thus, with the current optimistic view on the economy, we do not expect the S&P 500 index to form a market top anytime soon. As long as the ISM Manufacturing PMI stays in an expansionary phase, above 50, the general equity market should continue to do well.
Bear in mind the ISM Manufacturing PMI follows a sine wave pattern where it moves in cycles of expansion to contraction. Whenever the PMI enters into extremes, a mean reversion tends to take place, reversing the trend. Our study shows the extreme optimism level is around 58.1 where a mean reversion lower usually happens. Hence, the current outlook of the ISM Manufacturing PMI is ripe for a mean reversion lower even though there is no sign of any weakness yet. So keep that in mind. The only time to worry for the end of the US equity bull market is when the ISM Manufacturing PMI slips below 50, into contraction for at least two consecutive months.
With the current optimistic sentiment following 23 consecutive months of expansion, the general equity market in the US should remain in a robust uptrend. Moreover, the current reading of the ISM Manufacturing PMI at 61.3 is nowhere near contraction. The next likely target on the way up for the S&P 500 index is the 3000 psychological round number.
Important Information
This report is prepared and/or distributed by Phillip Securities Research Pte Ltd ("Phillip Securities Research"), which is a holder of a financial adviser’s licence under the Financial Advisers Act, Chapter 110 in Singapore.
By receiving or reading this report, you agree to be bound by the terms and limitations set out below. Any failure to comply with these terms and limitations may constitute a violation of law. This report has been provided to you for personal use only and shall not be reproduced, distributed or published by you in whole or in part, for any purpose. If you have received this report by mistake, please delete or destroy it, and notify the sender immediately.
The information and any analysis, forecasts, projections, expectations and opinions (collectively, the “Research”) contained in this report has been obtained from public sources which Phillip Securities Research believes to be reliable. However, Phillip Securities Research does not make any representation or warranty, express or implied that such information or Research is accurate, complete or appropriate or should be relied upon as such. Any such information or Research contained in this report is subject to change, and Phillip Securities Research shall not have any responsibility to maintain or update the information or Research made available or to supply any corrections, updates or releases in connection therewith.
Any opinions, forecasts, assumptions, estimates, valuations and prices contained in this report are as of the date indicated and are subject to change at any time without prior notice. Past performance of any product referred to in this report is not indicative of future results.
This report does not constitute, and should not be used as a substitute for, tax, legal or investment advice. This report should not be relied upon exclusively or as authoritative, without further being subject to the recipient’s own independent verification and exercise of judgment. The fact that this report has been made available constitutes neither a recommendation to enter into a particular transaction, nor a representation that any product described in this report is suitable or appropriate for the recipient. Recipients should be aware that many of the products, which may be described in this report involve significant risks and may not be suitable for all investors, and that any decision to enter into transactions involving such products should not be made, unless all such risks are understood and an independent determination has been made that such transactions would be appropriate. Any discussion of the risks contained herein with respect to any product should not be considered to be a disclosure of all risks or a complete discussion of such risks.
Nothing in this report shall be construed to be an offer or solicitation for the purchase or sale of any product. Any decision to purchase any product mentioned in this report should take into account existing public information, including any registered prospectus in respect of such product.
Phillip Securities Research, or persons associated with or connected to Phillip Securities Research, including but not limited to its officers, directors, employees or persons involved in the issuance of this report, may provide an array of financial services to a large number of corporations in Singapore and worldwide, including but not limited to commercial / investment banking activities (including sponsorship, financial advisory or underwriting activities), brokerage or securities trading activities. Phillip Securities Research, or persons associated with or connected to Phillip Securities Research, including but not limited to its officers, directors, employees or persons involved in the issuance of this report, may have participated in or invested in transactions with the issuer(s) of the securities mentioned in this report, and may have performed services for or solicited business from such issuers. Additionally, Phillip Securities Research, or persons associated with or connected to Phillip Securities Research, including but not limited to its officers, directors, employees or persons involved in the issuance of this report, may have provided advice or investment services to such companies and investments or related investments, as may be mentioned in this report.
Phillip Securities Research or persons associated with or connected to Phillip Securities Research, including but not limited to its officers, directors, employees or persons involved in the issuance of this report may, from time to time maintain a long or short position in securities referred to herein, or in related futures or options, purchase or sell, make a market in, or engage in any other transaction involving such securities, and earn brokerage or other compensation in respect of the foregoing. Investments will be denominated in various currencies including US dollars and Euro and thus will be subject to any fluctuation in exchange rates between US dollars and Euro or foreign currencies and the currency of your own jurisdiction. Such fluctuations may have an adverse effect on the value, price or income return of the investment.
To the extent permitted by law, Phillip Securities Research, or persons associated with or connected to Phillip Securities Research, including but not limited to its officers, directors, employees or persons involved in the issuance of this report, may at any time engage in any of the above activities as set out above or otherwise hold an interest, whether material or not, in respect of companies and investments or related investments, which may be mentioned in this report. Accordingly, information may be available to Phillip Securities Research, or persons associated with or connected to Phillip Securities Research, including but not limited to its officers, directors, employees or persons involved in the issuance of this report, which is not reflected in this report, and Phillip Securities Research, or persons associated with or connected to Phillip Securities Research, including but not limited to its officers, directors, employees or persons involved in the issuance of this report, may, to the extent permitted by law, have acted upon or used the information prior to or immediately following its publication. Phillip Securities Research, or persons associated with or connected to Phillip Securities Research, including but not limited its officers, directors, employees or persons involved in the issuance of this report, may have issued other material that is inconsistent with, or reach different conclusions from, the contents of this report.
The information, tools and material presented herein are not directed, intended for distribution to or use by, any person or entity in any jurisdiction or country where such distribution, publication, availability or use would be contrary to the applicable law or regulation or which would subject Phillip Securities Research to any registration or licensing or other requirement, or penalty for contravention of such requirements within such jurisdiction.
This report is intended for general circulation only and does not take into account the specific investment objectives, financial situation or particular needs of any particular person. The products mentioned in this report may not be suitable for all investors and a person receiving or reading this report should seek advice from a professional and financial adviser regarding the legal, business, financial, tax and other aspects including the suitability of such products, taking into account the specific investment objectives, financial situation or particular needs of that person, before making a commitment to invest in any of such products.
This report is not intended for distribution, publication to or use by any person in any jurisdiction outside of Singapore or any other jurisdiction as Phillip Securities Research may determine in its absolute discretion.
IMPORTANT DISCLOSURES FOR INCLUDED RESEARCH ANALYSES OR REPORTS OF FOREIGN RESEARCH HOUSE
Where the report contains research analyses or reports from a foreign research house, please note:

Jeremy specialises in Technical Analysis and has 10 years of experience in studying price action. His areas of expertise include intermarket analysis on the equities, currencies, commodities and bonds market.
He is also a regular columnist on The Business Times - every Monday ChartPoint column.
He graduated with a Bachelor of Science in Banking and Finance from University of London.
