
This article was published on Business Times’ column “Chart Point” on 30 October 2017.
Source: Bloomberg, PSR
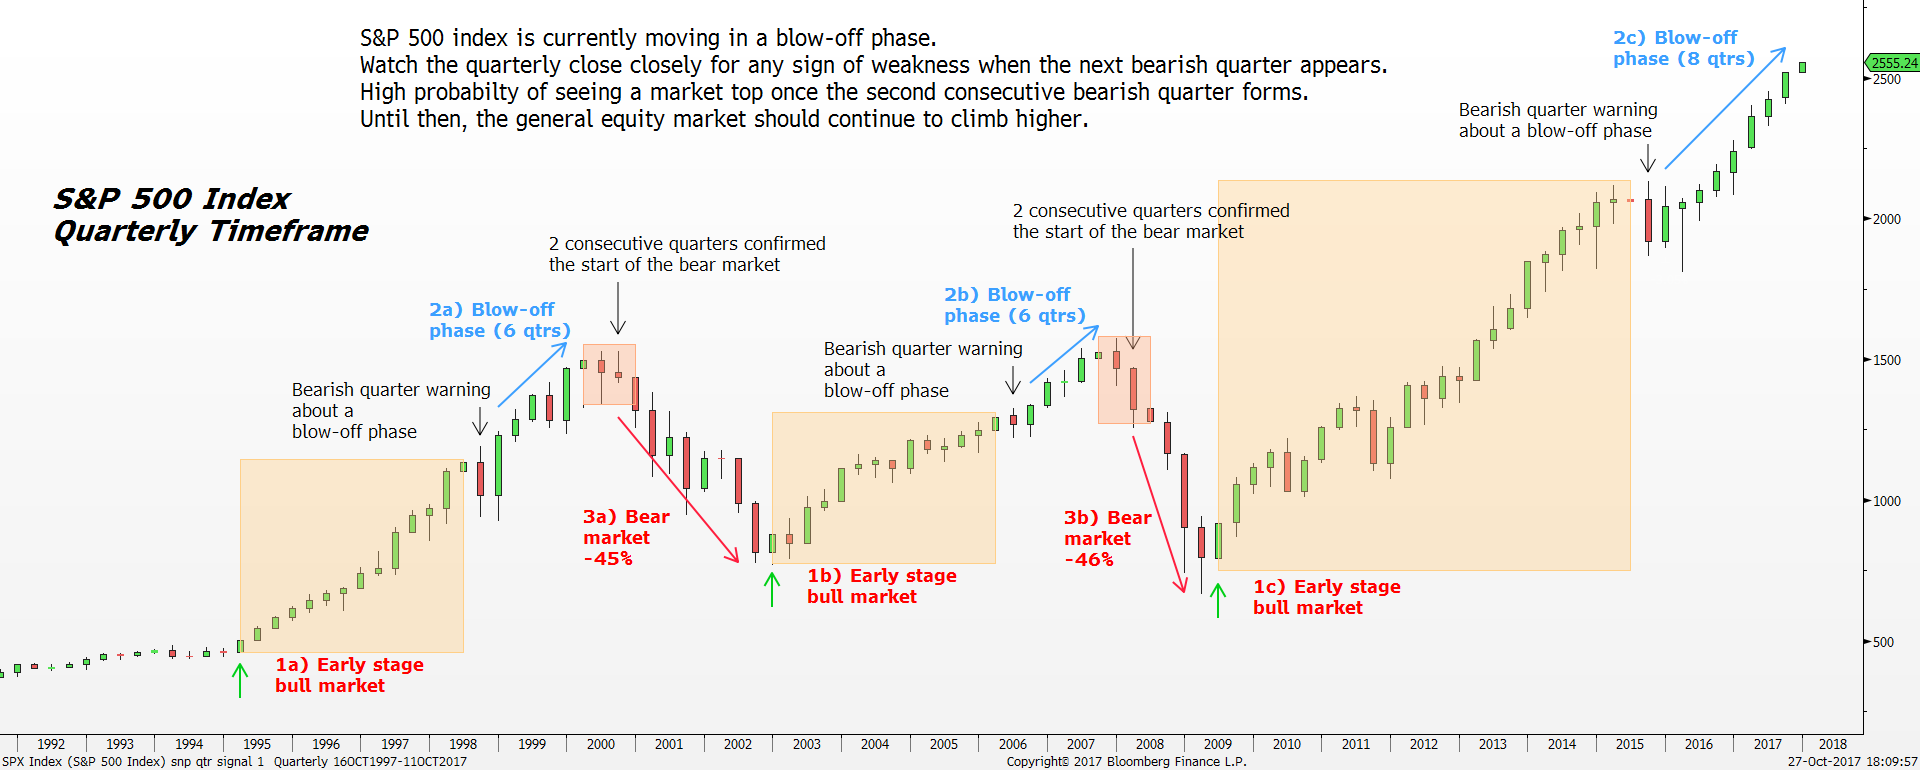
As we edge into the 100 months of economic expansion since 2009, the overall market remains unaffected by old age. Major equity indices such as the S&P 500 index continues to break new record highs. Zooming out to see the broader picture of the S&P 500 index on where we are in the current phase of bull market cycle reveals an intriguing price action pattern on the quarterly timeframe. The quarterly timeframe takes into account the performance of the S&P 500 index for each quarter to show if the particular quarter is a positive quarter (green bar) or negative quarter(red bar).
Our study has shown that the market can be divided into three main phases, namely:
In the early stages of a bull market, consecutive bullish quarters are a norm. However, once a bearish quarter interrupts the bullish momentum, that will be the time to be on guard for a volatile period ahead.
Dot-com boom: The early phase of the bull market took off in Q1 1995. The bullish momentum lasted for 14 consecutive quarters before some form of exhaustion appeared highlighted by the bearish quarter in Q3 1998. Nonetheless, the S&P 500 index continued to march higher into the blow-off phase subsequently for six more quarters before the Dot-Com bubble high was born in Q1 2000. The confirmation of the Dot-Com high was only triggered in Q3 2000 after sellers succeeded in forming the second consecutive bearish quarter. As the market transited into a bear market after the bearish confirmation, that exacerbated the selloff and resulted in a -45% wipe in the S&P 500 index.
Housing boom: The next recovery phase after Dot-Com bubble began in Q4 2002 after the first positive quarter surfaced. That was the signal for the start of the housing boom bull market. During this bull cycle, there were more disruptions in the uptrend shown by the bearish quarters in between 2002 to 2006. The real sign of exhaustion only appeared in Q2 2006 where the market proceeded along to the blow-off phase.
It took six more quarters of advancement to form the Global Financial Crisis (GFC) high in Q4 2007. After the second consecutive bearish quarter was formed in Q3 2008, the GFC high was subsequently confirmed, and the S&P 500 index plummeted 46% thereafter.
Current boom: Relating back to the current cycle, the current bull market began in Q2 2009 where the first bullish quarter materialized. Since then, we have experienced a spectacular bull run as the S&P 500 index broke above the Dot-com bubble and GFC high of 1552 points. However, we might be witnessing the blow-off phase now as a bearish warning quarter emerged in Q3 2015. The S&P 500 index crept higher after the negative quarter like the previous episodes, and we are currently in the eight consecutive quarters of advancement in the blow-off phase.
Keep in mind the top in the Dot-com and GFC era took exactly six quarters of blow-off phase to work out and we are currently in the eight quarters of the blow-off phase. Nevertheless, this is not to say that the market is going to top out soon.
Ultimately, two consecutive bearish quarters are required to confirm the market top. Thus, until the next bearish quarter appears, the S&P 500 index should continue to move along the current blow-off phase in search of new highs. Watch the quarterly close attentively to spot for the next bearish quarter for a sign of exhaustion. For that to happen in Q4 2017, it would require the S&P 500 index to close below 2521 points at the end of December.
Important Information
This report is prepared and/or distributed by Phillip Securities Research Pte Ltd ("Phillip Securities Research"), which is a holder of a financial adviser’s licence under the Financial Advisers Act, Chapter 110 in Singapore.
By receiving or reading this report, you agree to be bound by the terms and limitations set out below. Any failure to comply with these terms and limitations may constitute a violation of law. This report has been provided to you for personal use only and shall not be reproduced, distributed or published by you in whole or in part, for any purpose. If you have received this report by mistake, please delete or destroy it, and notify the sender immediately.
The information and any analysis, forecasts, projections, expectations and opinions (collectively, the “Research”) contained in this report has been obtained from public sources which Phillip Securities Research believes to be reliable. However, Phillip Securities Research does not make any representation or warranty, express or implied that such information or Research is accurate, complete or appropriate or should be relied upon as such. Any such information or Research contained in this report is subject to change, and Phillip Securities Research shall not have any responsibility to maintain or update the information or Research made available or to supply any corrections, updates or releases in connection therewith.
Any opinions, forecasts, assumptions, estimates, valuations and prices contained in this report are as of the date indicated and are subject to change at any time without prior notice. Past performance of any product referred to in this report is not indicative of future results.
This report does not constitute, and should not be used as a substitute for, tax, legal or investment advice. This report should not be relied upon exclusively or as authoritative, without further being subject to the recipient’s own independent verification and exercise of judgment. The fact that this report has been made available constitutes neither a recommendation to enter into a particular transaction, nor a representation that any product described in this report is suitable or appropriate for the recipient. Recipients should be aware that many of the products, which may be described in this report involve significant risks and may not be suitable for all investors, and that any decision to enter into transactions involving such products should not be made, unless all such risks are understood and an independent determination has been made that such transactions would be appropriate. Any discussion of the risks contained herein with respect to any product should not be considered to be a disclosure of all risks or a complete discussion of such risks.
Nothing in this report shall be construed to be an offer or solicitation for the purchase or sale of any product. Any decision to purchase any product mentioned in this report should take into account existing public information, including any registered prospectus in respect of such product.
Phillip Securities Research, or persons associated with or connected to Phillip Securities Research, including but not limited to its officers, directors, employees or persons involved in the issuance of this report, may provide an array of financial services to a large number of corporations in Singapore and worldwide, including but not limited to commercial / investment banking activities (including sponsorship, financial advisory or underwriting activities), brokerage or securities trading activities. Phillip Securities Research, or persons associated with or connected to Phillip Securities Research, including but not limited to its officers, directors, employees or persons involved in the issuance of this report, may have participated in or invested in transactions with the issuer(s) of the securities mentioned in this report, and may have performed services for or solicited business from such issuers. Additionally, Phillip Securities Research, or persons associated with or connected to Phillip Securities Research, including but not limited to its officers, directors, employees or persons involved in the issuance of this report, may have provided advice or investment services to such companies and investments or related investments, as may be mentioned in this report.
Phillip Securities Research or persons associated with or connected to Phillip Securities Research, including but not limited to its officers, directors, employees or persons involved in the issuance of this report may, from time to time maintain a long or short position in securities referred to herein, or in related futures or options, purchase or sell, make a market in, or engage in any other transaction involving such securities, and earn brokerage or other compensation in respect of the foregoing. Investments will be denominated in various currencies including US dollars and Euro and thus will be subject to any fluctuation in exchange rates between US dollars and Euro or foreign currencies and the currency of your own jurisdiction. Such fluctuations may have an adverse effect on the value, price or income return of the investment.
To the extent permitted by law, Phillip Securities Research, or persons associated with or connected to Phillip Securities Research, including but not limited to its officers, directors, employees or persons involved in the issuance of this report, may at any time engage in any of the above activities as set out above or otherwise hold an interest, whether material or not, in respect of companies and investments or related investments, which may be mentioned in this report. Accordingly, information may be available to Phillip Securities Research, or persons associated with or connected to Phillip Securities Research, including but not limited to its officers, directors, employees or persons involved in the issuance of this report, which is not reflected in this report, and Phillip Securities Research, or persons associated with or connected to Phillip Securities Research, including but not limited to its officers, directors, employees or persons involved in the issuance of this report, may, to the extent permitted by law, have acted upon or used the information prior to or immediately following its publication. Phillip Securities Research, or persons associated with or connected to Phillip Securities Research, including but not limited its officers, directors, employees or persons involved in the issuance of this report, may have issued other material that is inconsistent with, or reach different conclusions from, the contents of this report.
The information, tools and material presented herein are not directed, intended for distribution to or use by, any person or entity in any jurisdiction or country where such distribution, publication, availability or use would be contrary to the applicable law or regulation or which would subject Phillip Securities Research to any registration or licensing or other requirement, or penalty for contravention of such requirements within such jurisdiction.
This report is intended for general circulation only and does not take into account the specific investment objectives, financial situation or particular needs of any particular person. The products mentioned in this report may not be suitable for all investors and a person receiving or reading this report should seek advice from a professional and financial adviser regarding the legal, business, financial, tax and other aspects including the suitability of such products, taking into account the specific investment objectives, financial situation or particular needs of that person, before making a commitment to invest in any of such products.
This report is not intended for distribution, publication to or use by any person in any jurisdiction outside of Singapore or any other jurisdiction as Phillip Securities Research may determine in its absolute discretion.
IMPORTANT DISCLOSURES FOR INCLUDED RESEARCH ANALYSES OR REPORTS OF FOREIGN RESEARCH HOUSE
Where the report contains research analyses or reports from a foreign research house, please note:

Jeremy specialises in Technical Analysis and has 10 years of experience in studying price action. His areas of expertise include intermarket analysis on the equities, currencies, commodities and bonds market.
He is also a regular columnist on The Business Times - every Monday ChartPoint column.
He graduated with a Bachelor of Science in Banking and Finance from University of London.
