
This article was published in Business Times’ column “Chart Point” on 12 February 2018.
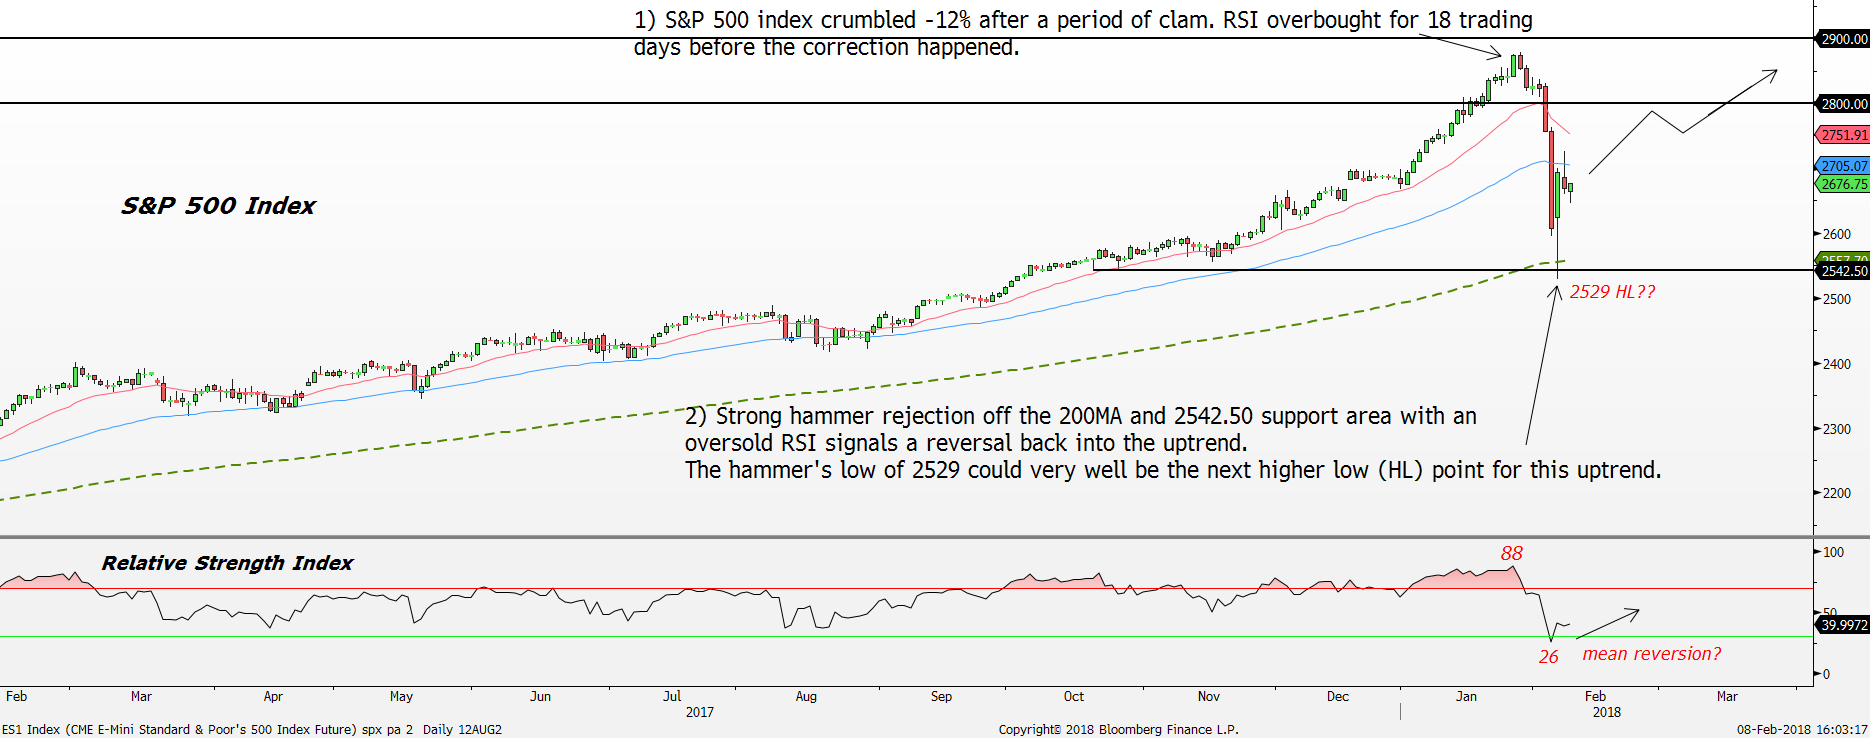
S&P 500 Daily Timeframe Chart Source: Bloomberg, PSR
Red line = 20 day exponential moving average, Blue line = 60 ema, Green line = 200 ema
As the S&P 500 index crumbled in the past week, fireworks were lid in the volatile complex. The mother of all short squeeze occurred in the VIX index as it spiked up 218% from 11.71 to 37.3 since the S&P 500 index hit a record high on 29 January 2018. At the same time, the S&P 500 index only corrected 8.79%. The disproportionate move between the S&P 500 index and VIX index was mainly due to the over excessive shorts in Volatility where speculators have been piling on since 2017, expecting things to remain relatively calm. At one point, the amount of shorts in the Futures market according to COT report hit an unprecedented high of 354,000 contracts.
Short squeeze of epic proportion creates chaos to the market as weak hands are forced to close out their position, thus further lifting the VIX index higher, starting the vicious cycle.
However, with the recent panic selling in the equity market, we might be seeing some opportunities to hop back on the market. The selloff that happened over the past two weeks took the S&P 500 index down 12% from the 2878 all-time high to the 6 February 2018 intraday day low of 2529.
Historically, the market does not just form an inverted V shape top at the cyclical high at the end of the economic boom cycle. Instead, there is always some form of consolidation, distribution at the top before the market rolls over. Corrections of up to -10% over a short timeframe are a norm when the market is reaching the cyclical peak, but a rebound back to the prior high usually happens. It can be seen as the last rally before the blow-off top forms.
For example, both the Dot-com high and Great Financial Crisis high saw wild market gyrations at the top for around 11 months before the market establishes the final top. During the Dot-Com peak period, there were three occasions where the S&P 500 index experienced corrections ranging between -11% to -14%. These corrections were eventually halted where the last dead-cat bounce took price back into the record highs before the market eventually rolled over.
The same happened during the GFC high period where the S&P 500 index underwent a -12% correction in July 2007 before the market entered into the last leg higher.
Therefore, we might be seeing a replay here as the most recent panic selling led to a -12% correction in the S&P 500 index. Expect limited downside moving forward and a rebound higher as buyers target the 2870 record high.
Moreover, from the price action perspective, on the daily timeframe, some sign of stabilization appeared lately after buyers found some support at the confluence of 200 day moving average and 2542 support area. After plunging to an intraday low of 2529 on 6 February, relentless buying surfaced and succeeded in closing the S&P 500 index at 2699, near the days high. As a result, the 6% recovery off the 2529 intraday low formed a strong hammer bullish reversal pattern signals a potential turn around back into the uptrend.
Just before the S&P 500 index peaked, the Relative Strength Index (RSI) was trading above the overbought condition for a whopping 18 trading days suggesting extreme euphoria. Hence, the recent selloff has rebalanced the market structure by getting rid of the extreme buying sentiment as the RSI crashed back down into a more normalized range. In fact, the RSI signalled oversold condition on 5 February as it hit a low of 26 suggesting a rebound higher next.
Thus, with the strong hammer bullish price action and oversold RSI, expect the S&P 500 index to head back into the prior uptrend to retest the 2800 resistance area. A more critical level to watch on the downside is the 2500 psychological support area.
Important Information
This report is prepared and/or distributed by Phillip Securities Research Pte Ltd ("Phillip Securities Research"), which is a holder of a financial adviser’s licence under the Financial Advisers Act, Chapter 110 in Singapore.
By receiving or reading this report, you agree to be bound by the terms and limitations set out below. Any failure to comply with these terms and limitations may constitute a violation of law. This report has been provided to you for personal use only and shall not be reproduced, distributed or published by you in whole or in part, for any purpose. If you have received this report by mistake, please delete or destroy it, and notify the sender immediately.
The information and any analysis, forecasts, projections, expectations and opinions (collectively, the “Research”) contained in this report has been obtained from public sources which Phillip Securities Research believes to be reliable. However, Phillip Securities Research does not make any representation or warranty, express or implied that such information or Research is accurate, complete or appropriate or should be relied upon as such. Any such information or Research contained in this report is subject to change, and Phillip Securities Research shall not have any responsibility to maintain or update the information or Research made available or to supply any corrections, updates or releases in connection therewith.
Any opinions, forecasts, assumptions, estimates, valuations and prices contained in this report are as of the date indicated and are subject to change at any time without prior notice. Past performance of any product referred to in this report is not indicative of future results.
This report does not constitute, and should not be used as a substitute for, tax, legal or investment advice. This report should not be relied upon exclusively or as authoritative, without further being subject to the recipient’s own independent verification and exercise of judgment. The fact that this report has been made available constitutes neither a recommendation to enter into a particular transaction, nor a representation that any product described in this report is suitable or appropriate for the recipient. Recipients should be aware that many of the products, which may be described in this report involve significant risks and may not be suitable for all investors, and that any decision to enter into transactions involving such products should not be made, unless all such risks are understood and an independent determination has been made that such transactions would be appropriate. Any discussion of the risks contained herein with respect to any product should not be considered to be a disclosure of all risks or a complete discussion of such risks.
Nothing in this report shall be construed to be an offer or solicitation for the purchase or sale of any product. Any decision to purchase any product mentioned in this report should take into account existing public information, including any registered prospectus in respect of such product.
Phillip Securities Research, or persons associated with or connected to Phillip Securities Research, including but not limited to its officers, directors, employees or persons involved in the issuance of this report, may provide an array of financial services to a large number of corporations in Singapore and worldwide, including but not limited to commercial / investment banking activities (including sponsorship, financial advisory or underwriting activities), brokerage or securities trading activities. Phillip Securities Research, or persons associated with or connected to Phillip Securities Research, including but not limited to its officers, directors, employees or persons involved in the issuance of this report, may have participated in or invested in transactions with the issuer(s) of the securities mentioned in this report, and may have performed services for or solicited business from such issuers. Additionally, Phillip Securities Research, or persons associated with or connected to Phillip Securities Research, including but not limited to its officers, directors, employees or persons involved in the issuance of this report, may have provided advice or investment services to such companies and investments or related investments, as may be mentioned in this report.
Phillip Securities Research or persons associated with or connected to Phillip Securities Research, including but not limited to its officers, directors, employees or persons involved in the issuance of this report may, from time to time maintain a long or short position in securities referred to herein, or in related futures or options, purchase or sell, make a market in, or engage in any other transaction involving such securities, and earn brokerage or other compensation in respect of the foregoing. Investments will be denominated in various currencies including US dollars and Euro and thus will be subject to any fluctuation in exchange rates between US dollars and Euro or foreign currencies and the currency of your own jurisdiction. Such fluctuations may have an adverse effect on the value, price or income return of the investment.
To the extent permitted by law, Phillip Securities Research, or persons associated with or connected to Phillip Securities Research, including but not limited to its officers, directors, employees or persons involved in the issuance of this report, may at any time engage in any of the above activities as set out above or otherwise hold an interest, whether material or not, in respect of companies and investments or related investments, which may be mentioned in this report. Accordingly, information may be available to Phillip Securities Research, or persons associated with or connected to Phillip Securities Research, including but not limited to its officers, directors, employees or persons involved in the issuance of this report, which is not reflected in this report, and Phillip Securities Research, or persons associated with or connected to Phillip Securities Research, including but not limited to its officers, directors, employees or persons involved in the issuance of this report, may, to the extent permitted by law, have acted upon or used the information prior to or immediately following its publication. Phillip Securities Research, or persons associated with or connected to Phillip Securities Research, including but not limited its officers, directors, employees or persons involved in the issuance of this report, may have issued other material that is inconsistent with, or reach different conclusions from, the contents of this report.
The information, tools and material presented herein are not directed, intended for distribution to or use by, any person or entity in any jurisdiction or country where such distribution, publication, availability or use would be contrary to the applicable law or regulation or which would subject Phillip Securities Research to any registration or licensing or other requirement, or penalty for contravention of such requirements within such jurisdiction.
This report is intended for general circulation only and does not take into account the specific investment objectives, financial situation or particular needs of any particular person. The products mentioned in this report may not be suitable for all investors and a person receiving or reading this report should seek advice from a professional and financial adviser regarding the legal, business, financial, tax and other aspects including the suitability of such products, taking into account the specific investment objectives, financial situation or particular needs of that person, before making a commitment to invest in any of such products.
This report is not intended for distribution, publication to or use by any person in any jurisdiction outside of Singapore or any other jurisdiction as Phillip Securities Research may determine in its absolute discretion.
IMPORTANT DISCLOSURES FOR INCLUDED RESEARCH ANALYSES OR REPORTS OF FOREIGN RESEARCH HOUSE
Where the report contains research analyses or reports from a foreign research house, please note:

Jeremy specialises in Technical Analysis and has 10 years of experience in studying price action. His areas of expertise include intermarket analysis on the equities, currencies, commodities and bonds market.
He is also a regular columnist on The Business Times - every Monday ChartPoint column.
He graduated with a Bachelor of Science in Banking and Finance from University of London.
