
This article was published on Business Times’ column “Chart Point” on 9 October 2017.
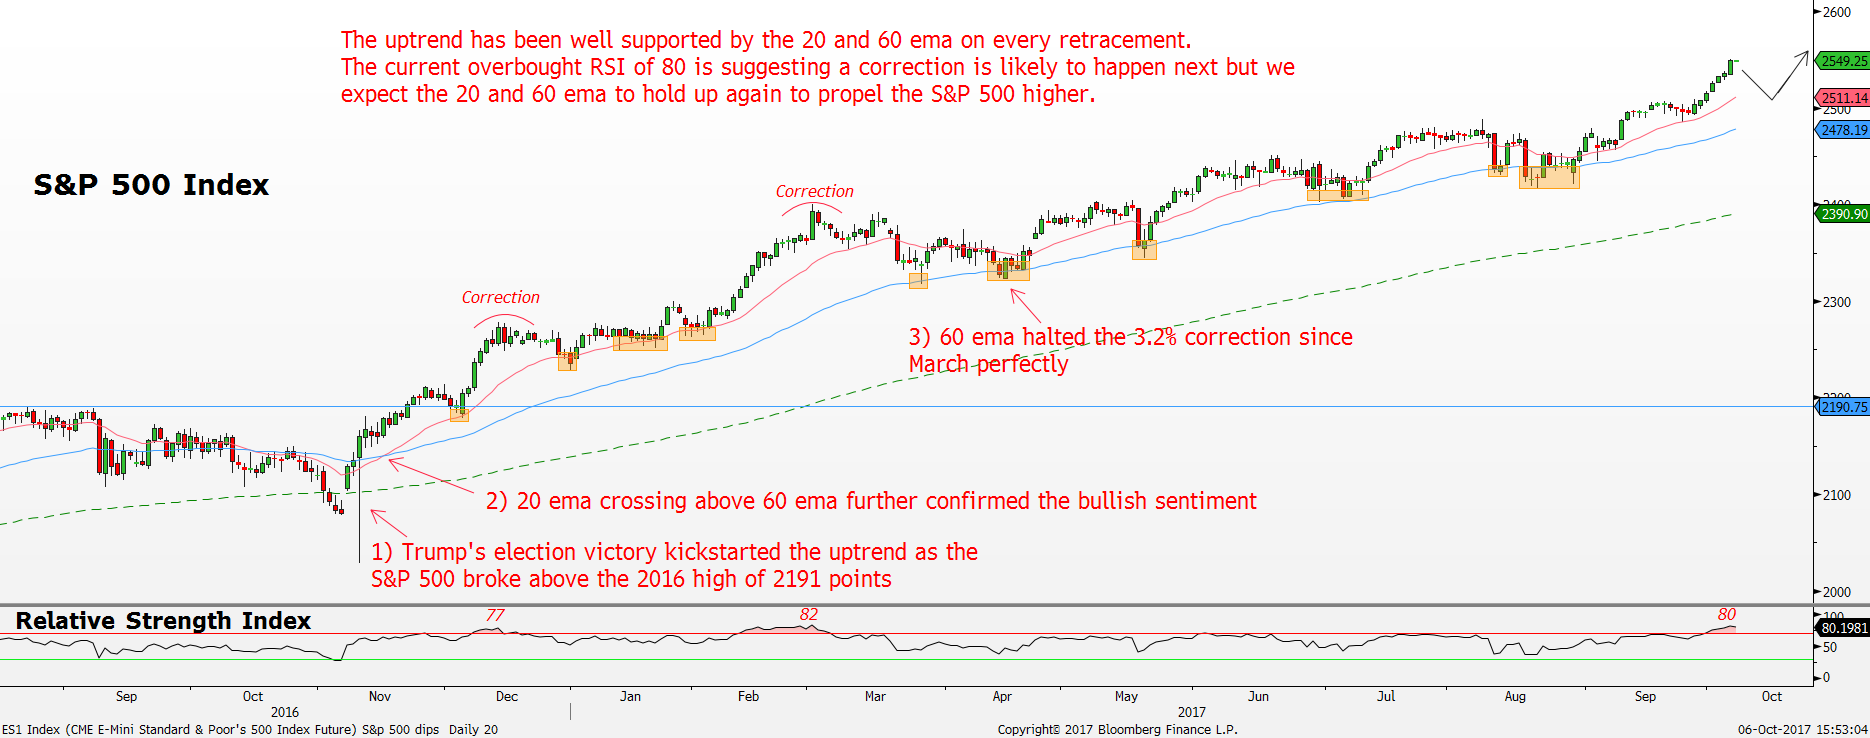
S&P 500 daily chart Source: Bloomberg, PSR
Red line = 20-day exponential moving average, Blue line = 60 ema, Green line = 200 ema
*Highlighted areas show the dip buying pattern off the 20 and 60 ema
With the 10th anniversary of the Great Financial Crisis (GFC) just ahead of us, the US equity market still appears firm and steady as it continues to break new record high. Current economic growth puts us in the third longest growth in history since 1933 at 99 months implying a late stage economic cycle. To put the economic growth cycle into context, the housing boom period of 2000 had an economic boom of only 73 months while the longest economic expansion growth came from the 1990s decade with 119 months. This is not to say that a major downturn will happen in the days to come but its good to know where we are in the current economic cycle. At the end of each economic expansion cycle comes a recession where the market tends to enter into a severe prolonged correction.
Looking at the price action of S&P 500 index, the current uptrend remains unshakeable even in the backdrop of rising geopolitical tensions in Korea. The market only sprang to life after November 2016 with the unexpected Trump presidency victory being the catalyst, taking out the 2016 high of 2193 points. Since then, the S&P 500 index trended higher steadily without a correction greater than 3.5% and the year to date gain of the S&P 500 index is 14%.
There seems to be a clear pattern to time the reversal of the market dips since 2017. The 20-day exponential moving average (ema) and 60-day ema acted perfectly as a springboard on every retracement shown by the highlighted areas where the uptrend takes back control. For example, the six weeks correction from 1 March was halted impeccably off the 60-day ema one month later in April moving the S&P 500 index back into the uptrend. EMA shows the average of the price over a defined number of time periods with greater weight placed on the recent prices.
With optimism prevailing, we expect the S&P 500 index to grind higher in the meantime as the 20 and 60 ema continues to propel price higher on any dips. Currently, the daily relative strength index (RSI) is implying an extremely overbought condition as it recently hit a high of 80. A correction is likely to happen when the RSI enters into extremely overbought condition just like in December 2016 and March 2017 where the RSI hit a high of 77 and 82 respectively. Hence, the next time a correction happens, the 20 or 60 ema would most likely reverse the selloff and relaunch the S&P 500 index back into the uptrend in search of the next record high.
On the other hand, on the bearish side, a major shift in sentiment will only occur after the S&P 500 index breaks below the 20 and 60 ema significantly. Further confirmation of a trend reversal will be flagged out once the 20 ema crosses below the 60 ema.
To sum up, watch the 20 and 60 ema closely as that will dictate if the uptrend remains valid or broken. Do note that this dip buying pattern is also apparent in the Dow Jones Industrial Average and Nasdaq 100 index.
Important Information
This report is prepared and/or distributed by Phillip Securities Research Pte Ltd ("Phillip Securities Research"), which is a holder of a financial adviser’s licence under the Financial Advisers Act, Chapter 110 in Singapore.
By receiving or reading this report, you agree to be bound by the terms and limitations set out below. Any failure to comply with these terms and limitations may constitute a violation of law. This report has been provided to you for personal use only and shall not be reproduced, distributed or published by you in whole or in part, for any purpose. If you have received this report by mistake, please delete or destroy it, and notify the sender immediately.
The information and any analysis, forecasts, projections, expectations and opinions (collectively, the “Research”) contained in this report has been obtained from public sources which Phillip Securities Research believes to be reliable. However, Phillip Securities Research does not make any representation or warranty, express or implied that such information or Research is accurate, complete or appropriate or should be relied upon as such. Any such information or Research contained in this report is subject to change, and Phillip Securities Research shall not have any responsibility to maintain or update the information or Research made available or to supply any corrections, updates or releases in connection therewith.
Any opinions, forecasts, assumptions, estimates, valuations and prices contained in this report are as of the date indicated and are subject to change at any time without prior notice. Past performance of any product referred to in this report is not indicative of future results.
This report does not constitute, and should not be used as a substitute for, tax, legal or investment advice. This report should not be relied upon exclusively or as authoritative, without further being subject to the recipient’s own independent verification and exercise of judgment. The fact that this report has been made available constitutes neither a recommendation to enter into a particular transaction, nor a representation that any product described in this report is suitable or appropriate for the recipient. Recipients should be aware that many of the products, which may be described in this report involve significant risks and may not be suitable for all investors, and that any decision to enter into transactions involving such products should not be made, unless all such risks are understood and an independent determination has been made that such transactions would be appropriate. Any discussion of the risks contained herein with respect to any product should not be considered to be a disclosure of all risks or a complete discussion of such risks.
Nothing in this report shall be construed to be an offer or solicitation for the purchase or sale of any product. Any decision to purchase any product mentioned in this report should take into account existing public information, including any registered prospectus in respect of such product.
Phillip Securities Research, or persons associated with or connected to Phillip Securities Research, including but not limited to its officers, directors, employees or persons involved in the issuance of this report, may provide an array of financial services to a large number of corporations in Singapore and worldwide, including but not limited to commercial / investment banking activities (including sponsorship, financial advisory or underwriting activities), brokerage or securities trading activities. Phillip Securities Research, or persons associated with or connected to Phillip Securities Research, including but not limited to its officers, directors, employees or persons involved in the issuance of this report, may have participated in or invested in transactions with the issuer(s) of the securities mentioned in this report, and may have performed services for or solicited business from such issuers. Additionally, Phillip Securities Research, or persons associated with or connected to Phillip Securities Research, including but not limited to its officers, directors, employees or persons involved in the issuance of this report, may have provided advice or investment services to such companies and investments or related investments, as may be mentioned in this report.
Phillip Securities Research or persons associated with or connected to Phillip Securities Research, including but not limited to its officers, directors, employees or persons involved in the issuance of this report may, from time to time maintain a long or short position in securities referred to herein, or in related futures or options, purchase or sell, make a market in, or engage in any other transaction involving such securities, and earn brokerage or other compensation in respect of the foregoing. Investments will be denominated in various currencies including US dollars and Euro and thus will be subject to any fluctuation in exchange rates between US dollars and Euro or foreign currencies and the currency of your own jurisdiction. Such fluctuations may have an adverse effect on the value, price or income return of the investment.
To the extent permitted by law, Phillip Securities Research, or persons associated with or connected to Phillip Securities Research, including but not limited to its officers, directors, employees or persons involved in the issuance of this report, may at any time engage in any of the above activities as set out above or otherwise hold an interest, whether material or not, in respect of companies and investments or related investments, which may be mentioned in this report. Accordingly, information may be available to Phillip Securities Research, or persons associated with or connected to Phillip Securities Research, including but not limited to its officers, directors, employees or persons involved in the issuance of this report, which is not reflected in this report, and Phillip Securities Research, or persons associated with or connected to Phillip Securities Research, including but not limited to its officers, directors, employees or persons involved in the issuance of this report, may, to the extent permitted by law, have acted upon or used the information prior to or immediately following its publication. Phillip Securities Research, or persons associated with or connected to Phillip Securities Research, including but not limited its officers, directors, employees or persons involved in the issuance of this report, may have issued other material that is inconsistent with, or reach different conclusions from, the contents of this report.
The information, tools and material presented herein are not directed, intended for distribution to or use by, any person or entity in any jurisdiction or country where such distribution, publication, availability or use would be contrary to the applicable law or regulation or which would subject Phillip Securities Research to any registration or licensing or other requirement, or penalty for contravention of such requirements within such jurisdiction.
This report is intended for general circulation only and does not take into account the specific investment objectives, financial situation or particular needs of any particular person. The products mentioned in this report may not be suitable for all investors and a person receiving or reading this report should seek advice from a professional and financial adviser regarding the legal, business, financial, tax and other aspects including the suitability of such products, taking into account the specific investment objectives, financial situation or particular needs of that person, before making a commitment to invest in any of such products.
This report is not intended for distribution, publication to or use by any person in any jurisdiction outside of Singapore or any other jurisdiction as Phillip Securities Research may determine in its absolute discretion.
IMPORTANT DISCLOSURES FOR INCLUDED RESEARCH ANALYSES OR REPORTS OF FOREIGN RESEARCH HOUSE
Where the report contains research analyses or reports from a foreign research house, please note:

Jeremy specialises in Technical Analysis and has 10 years of experience in studying price action. His areas of expertise include intermarket analysis on the equities, currencies, commodities and bonds market.
He is also a regular columnist on The Business Times - every Monday ChartPoint column.
He graduated with a Bachelor of Science in Banking and Finance from University of London.
