
What is the news?
JTC recently released its Quarterly Market Report of Industrial Properties for 4Q 2016.
Key takeaways from the quarter:
Generally negative reversions across the Industrial REITs, as the oversupply condition persists with muted demand. Exceptions of positive portfolio weighted average rental reversions during the quarter came from Ascendas REIT (A-REIT) (+3%) and Mapletree Industrial Trust (MINT) (+2.1%). Keppel DC REIT (KDCREIT) renewed a major lease in one of its Singapore properties for five-years, at approximately 3% higher rent than the preceding rate.
In our previous report (11 November 2016) for the Industrial sub-sector, we had cautioned on portfolio revaluation losses. With the exception of Viva Industrial Trust (VIT), all the other industrial REITs that ended their fiscal year in December 2016 recorded fair value losses to investment properties.
We observed that asking rents being posted by leasing agents had stabilised during the quarter. Our channel check suggests that there is still a fair amount of leasing activity on the ground and that rents may be bottoming. This was corroborated by one of the REIT CEOs during the results briefing who opined that we are close to the bottom for Industrial rents. We do however draw a distinction between rent level and rental reversions. We still are expecting softness for the sector, with aggregate reversions to be at least in the high negative single-digit region for 2017.
Investment Actions
We have downgraded our view on the overall S-REITs sector to “Underweight” in our most recent S-REIT sector report (6 February 2017). In this update report, we upgrade the Industrial sub-sector to “Equal Weight” on optimism of the bottoming of Industrial rents this year.
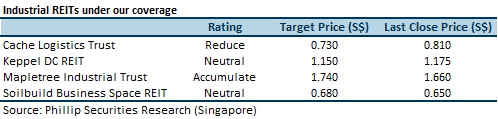
Cache Logistics Trust (Cache) – High gearing of 43.1% is the key idiosyncratic impediment to inorganic growth
Keppel DC REIT (KDCREIT) – Expecting 30% yoy higher gross revenue in FY17 driven by two acquisitions completed in FY16 and one in January 2017
Mapletree Industrial Trust (MINT) – Firepower to acquire: 29.4% gearing is one of the lowest within the S-REIT universe
Soilbuild Business Space REIT (SBREIT) – Tough year ahead to backfill Loyang Way property
How do we view this?
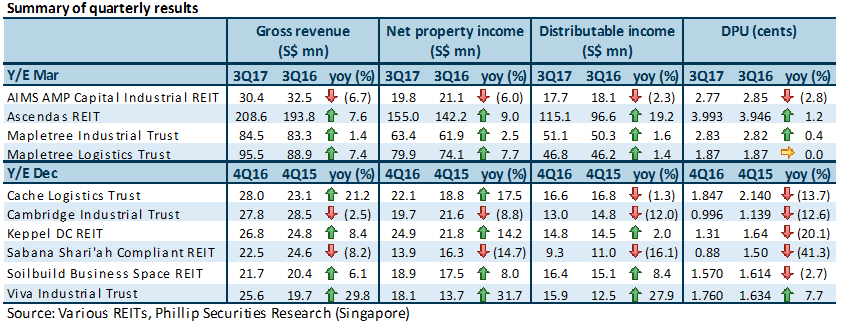
We highlighted the first signs of the uptick in industrial activity in our previous report (11 November 2016). For the month of September 2016, the Purchasing Manager’s Index (PMI) had its first expansionary month (50.1) in the year and Industrial Production had an encouraging 6.7% yoy growth.
Singapore’s PMI has been in expansionary mode since late-2016 to January 2017. This is in line with expansionary global PMIs such as Eurozone, USA, China and Japan. Singapore Industrial Production Index in December 2016 was 21.3% higher yoy and 6.4% higher on a seasonally-adjusted month-on-month (mom) basis. We are optimistic on a recovery for the PMI and Industrial Production Index, but not before moderating downwards to a more sustainable level. While this could signal the start of higher demand for Industrial space, upcoming new supply is still higher than historical supply, and demand now is lower than historical demand.
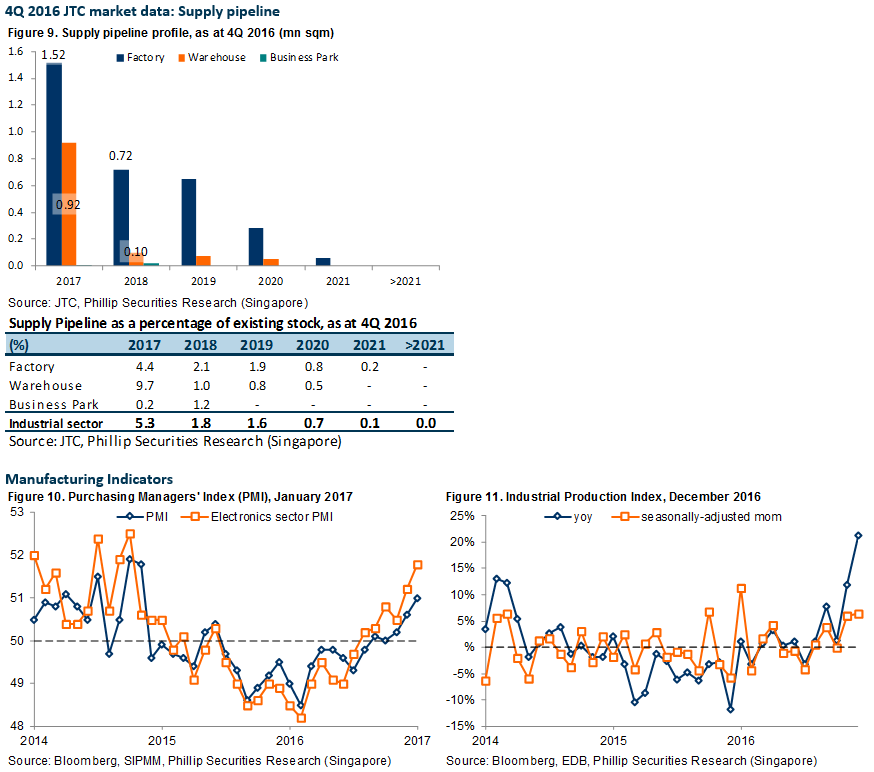
The net increase in Industrial space in 2016 was 1.82mn sqm, bringing existing stock to 46.28mn sqm as at 4Q 2016. JTC estimates about 2.4mn sqm of industrial space to come on-stream in 2017. The additional space coming on stream is significantly higher than the average annual supply of around 1.8mn sqm in the past three years. Historical average demand over the past three years was 1.3mn sqm.
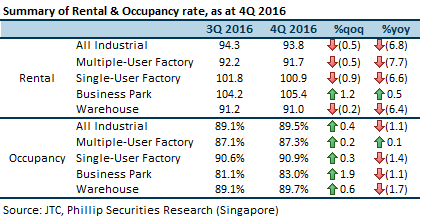
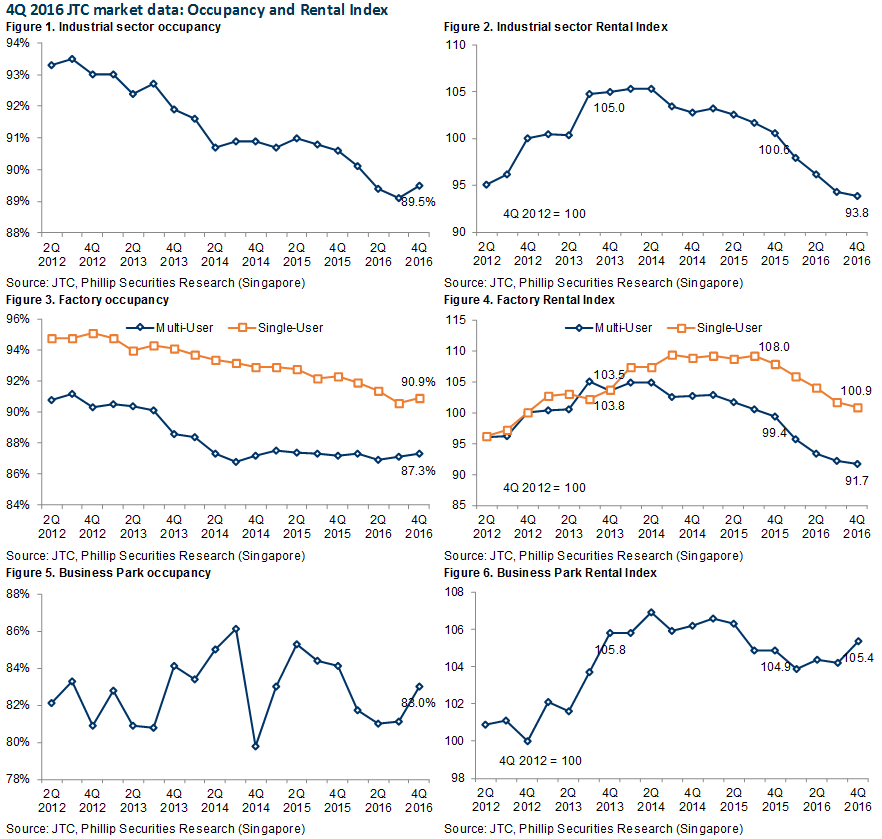
4Q 2016 Rental Index (93.8) is lower than three years ago in 4Q 2013 (105.0), and below the levels last seen in 2012. What this means is that lease renewals signed in 4Q 2016 were at lower rents compared to three years ago, and implying negative reversions of -10.7% in aggregate. This does not come as a surprise as we had already flagged in our previous report (11 November 2016) our expectations for aggregate reversions to reach negative double-digit territory into 2017.
In our previous report (11 November 2016), we opined that Factory space would be the hardest hit in 4Q 2016. This did materialise as evident from Multiple-User and Single-User Factory space having the highest negative change in the Rental Index on both quarter-on-quarter (qoq) and yoy basis (refer to table on Page 1).
Planned supply of Factory space of 1.52mn sqm for 2017 is about 49% more than the net new supply of 1.02mn sq mn in 2016. Of which planned supply of 548,000 sqm of Multiple-User Factory space in 2017 is 133% more than the net new supply of 235,000 sqm in 2016. Rental Index for Multiple-User in 4Q 2016 (91.7) was 11.4% lower compared to three years ago in 4Q 2013 (103.5). We are of the view that rental reversions in 2017 for Multiple-User Factory space will likely continue to be negative low double-digit. Our previous view was for negative double-digit negative reversions up to mid-teens.
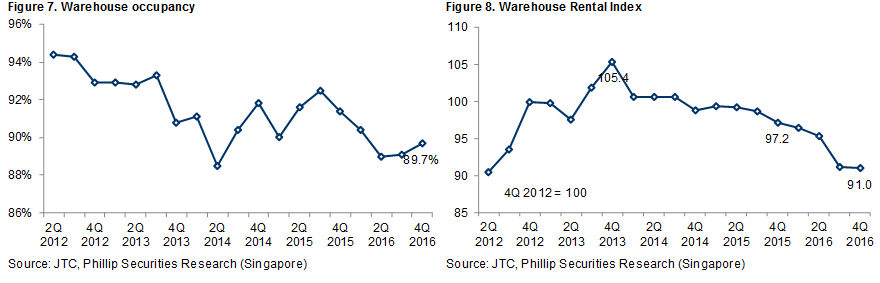
Warehouse Rental Index in 4Q 2016 (91.0) was also lower than three years ago in 4Q 2013 (105.4). This implies that Warehouse lease renewals done in 4Q 2016 were on negative reversion terms of about -14%. Negative reversions in 4Q 2016 was more pronounced because the peak Rental Index of 105.4 was exactly three years ago in 4Q 2013.
Total planned supply for 2017 is 923,000 sqm, which is 58% higher than the net new supply of 584,000 sqm in 2016. Planned supply for 2017 represents 9.7% additional space to existing stock as of 4Q 2016, compared to the 6.6% that was added during 2016. We are expecting negative low double-digit rental reversions in 2017.
New supply of Business Park space is limited in 2017 and 2018, with only 0.2% and 1.2% increase respectively, over current existing stock. There is currently no new supply planned from 2019 onwards. We are expecting Rental Index to remain stable qoq, but reversions to be flat in 2017. Our previous view was for flat reversions with a negative bias.
Strategic top-down view
We expect the demand-supply imbalance to persist into 2017. Although this would exert downward pressure on rent, we already see some stabilisation of asking rents and this could indicate the possible bottoming of rents. However, we emphasize the distinction between negative rental reversions and bottoming of rents. We expect to still see negative reversions in 2017.
Tactical bottom-up view
Management has demonstrated the ability to grow the portfolio organically with the BTS project and ongoing asset enhancement project (AEI) at Kallang Basin 4 Cluster, while simultaneously managing capital structure.
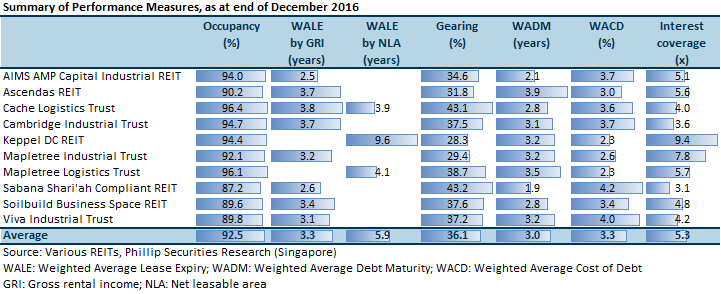
MINT’s gearing of 29.4% is one of the lowest within the S-REIT universe. Weighted average debt maturity of the REIT is 3.2 years, with 2.8%/17.0% of debt maturing in FY17/FY18 respectively. 67.0% of debt is hedged on fixed rate and the interest cover ratio is a healthy 7.8x, compared to the sub-sector average of 5.3x.
Commentary for quarterly and full year results across the Industrial REITs sub-sector
Inorganic growth in gross revenue was due to acquisitions at A-REIT, Mapletree Logistics Trust (MLT), Cache, KDCREIT and VIT. Organic growth in gross revenue was due to completion of Phase One of the Hewlett-Packard BTS project at MINT and the Mapletree Logistics Hub – Toh Guan coming back on line upon completion of the asset enhancement initiative (AEI) for MLT.
Yoy decline in DPU for AIMS AMP Capital Industrial REIT (AAREIT) and Cambridge Industrial Trust (CIT) was in line with the yoy decline in distributable income. For a few of the REITs, distributable income was decimated at the yoy reported DPU level due to equity fund raising through Rights Issue (Sabana Shari’ah Compliant REIT (SSREIT)), Preferential Offering (SBREIT, KDCREIT, VIT), Private Placement (Cache, VIT).
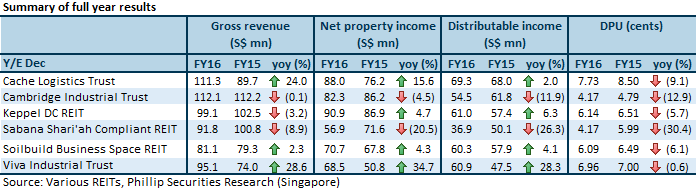
Gross revenue for Cache and VIT grew substantially due to acquisitions. Higher gross revenue for Cache was from acquisition of six properties in Australia, and contribution from the DHL Supply Chain Advanced Regional Centre (DSC ARC). Higher gross revenue for VIT was from Viva Business Park (VBP) and other properties (19 Tai Seng Avenue, Home-Fix Building, 11 Ubi Road and 30 Pioneer Road).
Reasons for lower gross revenue for the other REITs include downsizing by client, conversions of master-lease properties to multi-tenancies, negative rental reversions and divestment.
Full year reported DPU was lower yoy across the board. Lower DPU for CIT was in line with the lower distributable income. For the rest of the REITs, distributable income was decimated at the DPU level due to equity fund raising through Rights Issue (SSREIT), Preferential Offering (SBREIT, KDCREIT, VIT) and Private Placement (Cache, VIT).
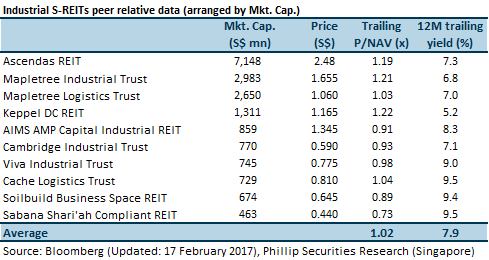
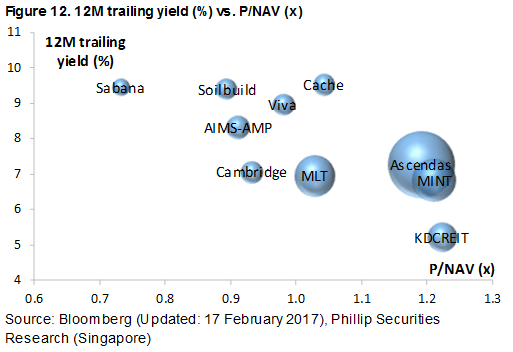
Review of Performance Measures of Industrial S-REITs
Average occupancy of 92.5% among the Industrial S-REITs was higher than the JTC sector-wide occupancy of 89.5%.
Peer relative valuation
Important Information
This report is prepared and/or distributed by Phillip Securities Research Pte Ltd ("Phillip Securities Research"), which is a holder of a financial adviser’s licence under the Financial Advisers Act, Chapter 110 in Singapore.
By receiving or reading this report, you agree to be bound by the terms and limitations set out below. Any failure to comply with these terms and limitations may constitute a violation of law. This report has been provided to you for personal use only and shall not be reproduced, distributed or published by you in whole or in part, for any purpose. If you have received this report by mistake, please delete or destroy it, and notify the sender immediately.
The information and any analysis, forecasts, projections, expectations and opinions (collectively, the “Research”) contained in this report has been obtained from public sources which Phillip Securities Research believes to be reliable. However, Phillip Securities Research does not make any representation or warranty, express or implied that such information or Research is accurate, complete or appropriate or should be relied upon as such. Any such information or Research contained in this report is subject to change, and Phillip Securities Research shall not have any responsibility to maintain or update the information or Research made available or to supply any corrections, updates or releases in connection therewith.
Any opinions, forecasts, assumptions, estimates, valuations and prices contained in this report are as of the date indicated and are subject to change at any time without prior notice. Past performance of any product referred to in this report is not indicative of future results.
This report does not constitute, and should not be used as a substitute for, tax, legal or investment advice. This report should not be relied upon exclusively or as authoritative, without further being subject to the recipient’s own independent verification and exercise of judgment. The fact that this report has been made available constitutes neither a recommendation to enter into a particular transaction, nor a representation that any product described in this report is suitable or appropriate for the recipient. Recipients should be aware that many of the products, which may be described in this report involve significant risks and may not be suitable for all investors, and that any decision to enter into transactions involving such products should not be made, unless all such risks are understood and an independent determination has been made that such transactions would be appropriate. Any discussion of the risks contained herein with respect to any product should not be considered to be a disclosure of all risks or a complete discussion of such risks.
Nothing in this report shall be construed to be an offer or solicitation for the purchase or sale of any product. Any decision to purchase any product mentioned in this report should take into account existing public information, including any registered prospectus in respect of such product.
Phillip Securities Research, or persons associated with or connected to Phillip Securities Research, including but not limited to its officers, directors, employees or persons involved in the issuance of this report, may provide an array of financial services to a large number of corporations in Singapore and worldwide, including but not limited to commercial / investment banking activities (including sponsorship, financial advisory or underwriting activities), brokerage or securities trading activities. Phillip Securities Research, or persons associated with or connected to Phillip Securities Research, including but not limited to its officers, directors, employees or persons involved in the issuance of this report, may have participated in or invested in transactions with the issuer(s) of the securities mentioned in this report, and may have performed services for or solicited business from such issuers. Additionally, Phillip Securities Research, or persons associated with or connected to Phillip Securities Research, including but not limited to its officers, directors, employees or persons involved in the issuance of this report, may have provided advice or investment services to such companies and investments or related investments, as may be mentioned in this report.
Phillip Securities Research or persons associated with or connected to Phillip Securities Research, including but not limited to its officers, directors, employees or persons involved in the issuance of this report may, from time to time maintain a long or short position in securities referred to herein, or in related futures or options, purchase or sell, make a market in, or engage in any other transaction involving such securities, and earn brokerage or other compensation in respect of the foregoing. Investments will be denominated in various currencies including US dollars and Euro and thus will be subject to any fluctuation in exchange rates between US dollars and Euro or foreign currencies and the currency of your own jurisdiction. Such fluctuations may have an adverse effect on the value, price or income return of the investment.
To the extent permitted by law, Phillip Securities Research, or persons associated with or connected to Phillip Securities Research, including but not limited to its officers, directors, employees or persons involved in the issuance of this report, may at any time engage in any of the above activities as set out above or otherwise hold an interest, whether material or not, in respect of companies and investments or related investments, which may be mentioned in this report. Accordingly, information may be available to Phillip Securities Research, or persons associated with or connected to Phillip Securities Research, including but not limited to its officers, directors, employees or persons involved in the issuance of this report, which is not reflected in this report, and Phillip Securities Research, or persons associated with or connected to Phillip Securities Research, including but not limited to its officers, directors, employees or persons involved in the issuance of this report, may, to the extent permitted by law, have acted upon or used the information prior to or immediately following its publication. Phillip Securities Research, or persons associated with or connected to Phillip Securities Research, including but not limited its officers, directors, employees or persons involved in the issuance of this report, may have issued other material that is inconsistent with, or reach different conclusions from, the contents of this report.
The information, tools and material presented herein are not directed, intended for distribution to or use by, any person or entity in any jurisdiction or country where such distribution, publication, availability or use would be contrary to the applicable law or regulation or which would subject Phillip Securities Research to any registration or licensing or other requirement, or penalty for contravention of such requirements within such jurisdiction.
This report is intended for general circulation only and does not take into account the specific investment objectives, financial situation or particular needs of any particular person. The products mentioned in this report may not be suitable for all investors and a person receiving or reading this report should seek advice from a professional and financial adviser regarding the legal, business, financial, tax and other aspects including the suitability of such products, taking into account the specific investment objectives, financial situation or particular needs of that person, before making a commitment to invest in any of such products.
This report is not intended for distribution, publication to or use by any person in any jurisdiction outside of Singapore or any other jurisdiction as Phillip Securities Research may determine in its absolute discretion.
IMPORTANT DISCLOSURES FOR INCLUDED RESEARCH ANALYSES OR REPORTS OF FOREIGN RESEARCH HOUSE
Where the report contains research analyses or reports from a foreign research house, please note:

Richard covers the Transport Sector and Industrial REITs. He graduated with a Master of Science in Applied Finance from the Singapore Management University. He holds the CFTe and FRM certifications and is a CFA charterholder.
He was ranked #2 Top Stock Picker (Asia) for Real Estate Investment Trusts in the 2018 Thomson Reuters Analyst Awards, and ranked #2 Top Stock Picker (Singapore) for Resources & Infrastructure in the 2016 Thomson Reuters Analyst Awards.
