
What is the news?
Key takeaways from the quarter
Generally negative reversions across the Industrial REITs, as oversupply condition persists. Even the Data Centre segment was not spared – Keppel DC REIT gave a negative reversion incentive, albeit on a forward renewal to a major customer that expanded its space requirement. Exceptions of positive portfolio weighted average reversions during the quarter came from Ascendas REIT (+4%) with Mapletree Industrial Trust (+0.5%) lagging behind.
We heard feedback from the REIT Managers that the key focus in the current soft market conditions is tenant retention. One Manager recounted an instance where it had a prospective tenant in late stage of negotiations and was eventually undercut by the tenant’s existing landlord.
Tenants are facing an uncertain outlook for their businesses and landlords are also allowing shorter lease to maintain occupancy – all in an effort to cushion the effects of the soft leasing market. Landlords are also resorting to leasing out partial units for short-term lease.
Investment Actions
We maintain our “Equal Weight” view on the overall S-REITs sector, from our most recent sector report (dated: 18 July 2016). We hold an “Underweight” view on the Industrial sub-sector within the S-REITs sector in view of weak demand and onslaught of new supply.
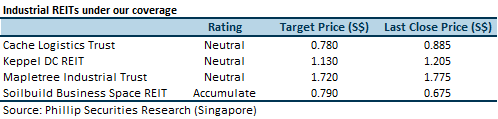
Cache Logistics Trust – Cautious over the possible overhang of Warehouse space.
Keppel DC REIT – Proxy to explosive growth in data requirements.
Mapletree Industrial Trust – DPU growth from pipeline of build-to-suit (BTS) and asset enhancement initiative (AEI) projects.
Soilbuild Business Space REIT (SBREIT) – Stability from master leases, and negligible vacancy risk for the rest of the year.
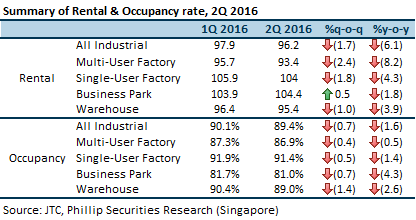
2Q 2016 JTC market data: Occupancy and Rental Index

2Q 2016 JTC market data: Supply pipeline
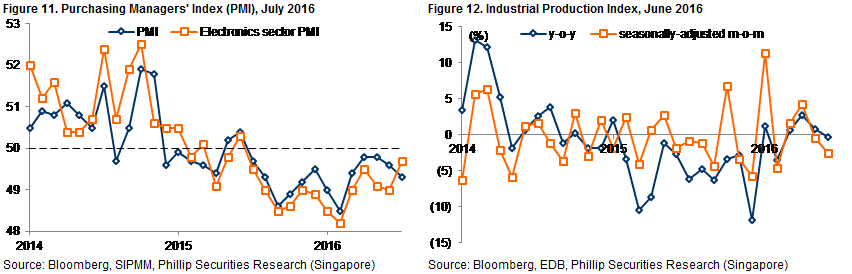
Manufacturing Indicators
How do we view this?
PMI has been below 50 for the most part of 2015, and for the whole of 2016 until July. Industrial Production Index fell 0.3% y-o-y and fell 2.5% on a seasonally adjusted m-o-m basis. These two indicators suggest a weak industrial outlook and we think it is highly unlikely for industrialists to go on a space expansion spree. As such, we continue to expect supply-demand imbalance to weigh against the sector, with cautious demand in the face of an onslaught of new space.
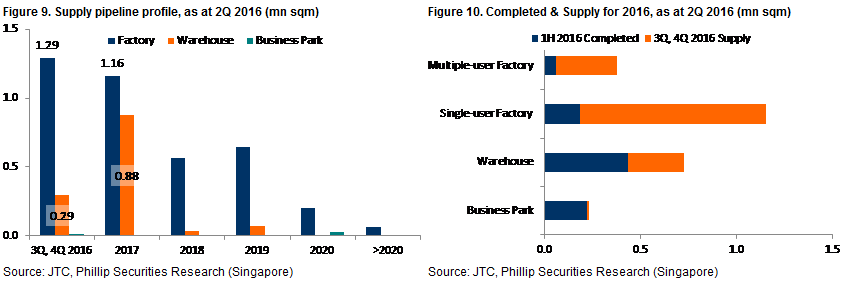
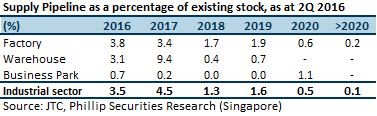
The existing stock of Industrial space is 45.4mn sqm as at 2Q 2016. JTC estimates about 1.60mn sqm and 2.04mn sqm of industrial space to come on-stream in 2H 2016 and 2017 respectively. This additional space in 2H 2016 and 2017 is a 3.5% and 4.5% increase over existing stock respectively. The additional space coming on stream is significantly higher than the average annual supply of around 1.7mn sqm in the past three years. Historical average demand over the past three years was 1.2mn sqm.
Industrial leases are typically for a tenure of three years. 2Q 2016 Rental Index (96.2) is lower than three years ago in 2Q 2013 (100.3), and at the levels last seen in 2012. What this means is that lease renewals signed in 2Q 2016 were at lower rents compared to three years ago, implying negative reversions in aggregate. Going forward, we expect aggregate reversions to be in a negative territory all the way into 2017.
Between the three types of industrial space (Factory, Warehouse & Business Park), we opine that Factory space will be the hardest hit in 2H 2016, particularly the Multiple-user Factory segment. 2Q 2016 Rental Index for Multiple-user Factory (93.4) is already lower than four years ago in 2Q 2012 (96.3), against the backdrop of only 16% of Multiple-user Factory space having been completed in 1H 2016; the remaining 84% of planned space will be coming on stream in 2H 2016. Our view is that going forward, subsequent leases signed will be on negative reversion terms probably all the way into 2017.
Similarly, only 16% of Single-user Factory was completed in 1H 2016, with the remaining 84% coming on stream in 2H 2016. Single-user space is typically pre-committed of the build-to-suit (BTS) or own-use configurations, and it is quite likely that such users would vacate their existing space to move into the new property once completed. This would contribute to further oversupply woes in the Multiple-user segment.
Warehouse Rental Index in 2Q 2016 (95.4) was also lower than three years ago (97.5). This implies that Warehouse lease renewals done in 2Q 2016 were on negative reversion terms. 60% of Warehouses were completed in 1H 2016, with the remaining 40% coming on stream in 2H 2016. Further downward pressure on rent is to be expected in 2H 2016 as the oversupply condition persists. Total planned supply for 2016 is 0.727mn sqm, with a 20% higher supply of 0.876mn sqm in 2017.
New supply of Business Park space is limited in 2H 2016 and 2017, with only 0.7% and 0.2% increase over current existing stock respectively. Currently no new supply planned for 2018 and 2019. 1.1% increase in available space in 2020, which is four years out from now. With Business Park Rental Index higher than three years ago, we still see the possibility for positive reversions in 2H 2016.
Strategic top-down view
As highlighted, there will be an imbalance in supply/demand dynamics in 2H 2016 going into 2017. This will result in a tenant’s market and apply downward pressure on both occupancy and rent.
Tactical bottom-up view
Keppel DC REIT has a unique asset class of data centres with strong underlying demand drivers. Its portfolio is diversified across seven cities, with 41% of FY15 GRI being derived from within Singapore. Acquisition of Keppel DC Singapore 3 (formerly known as T27) is expected to be completed in 3Q FY16. Mapletree Industrial Trust has ongoing BTS and AEI projects due to be completed by 2Q 2017 and 1Q 2018, respectively. Soilbuild Business Space REIT does not have any master leases expiring within the next two years. 3%/15% of portfolio leases by GRI expiring in 2016/2017.
AIMS AMP Capital Industrial REIT has master-lease (c.7% of rental income) of 20 Gul Way expiring in FY17 and three master leases (c.15% of rental income), namely 20 Gul Way (progressive expiry over four years from FY17 onwards), 3 Tuas Avenue 2 and 2 Ang Mo Kio Street 65 expiring in FY18.
Cambridge Industrial Trust has five properties (6.3% of rental income) with master-leases that are expiring in 2016. Two are expected to be divested, one to be renewed, one to be converted to multi-tenanted building and one to undergo AEI works.
Sabana Shari’ah Compliant REIT has four properties (20.5% of net leasable area) with master-leases expiring in 2016.
Commentary for quarterly results across the Industrial REITs sub-sector
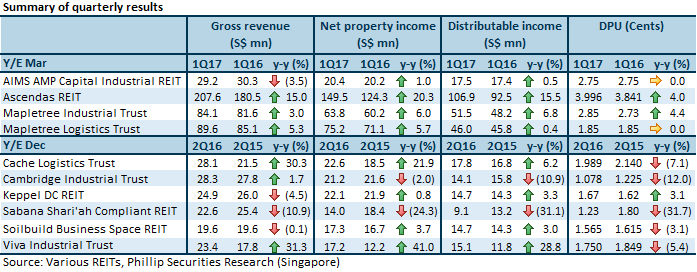
Gross revenue across the sub-sector grew mainly due to acquisitions, specifically at Ascendas REIT, Cache Logistics Trust, and Viva Industrial Trust. Completed AEI becoming income-producing at Cambridge Industrial Trust helped as well. Flat to negative rental reversions were seen across the board, with the exception of Ascendas REIT (+4%) and Mapletree Industrial Trust (+0.5%).
While generally in line across the sub-sector, some impact was reported by Mapletree Logistics Trust and Cache Logistics Trust due to prior conversions from master leases to multi-tenancies, with Sabana Shari’ah Compliant REIT bearing the full brunt of conversions to non-triple-net master lease tenancies.
DPU was broadly in line with Distributable income, except for dilutive effect from larger unit bases y-o-y at Cache Logistics Trust, Soilbuild Business Space REIT and Viva Industrial Trust. Absence of capital distribution contributed to lower y-o-y DPU at Cache Logistics Trust and Cambridge Industrial Trust.
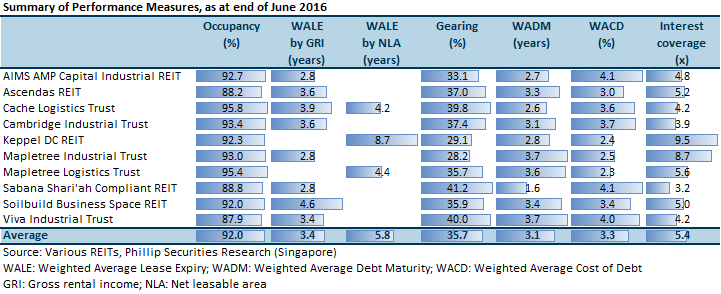
Review of Performance Measures of Industrial S-REITs
Average occupancy of 92.0% among the Industrial S-REITs was higher than the JTC sector-wide occupancy of 89.4%.
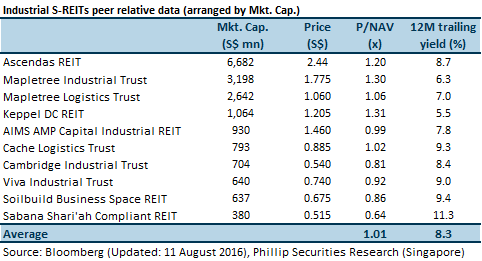
Peer relative valuation

Important Information
This report is prepared and/or distributed by Phillip Securities Research Pte Ltd ("Phillip Securities Research"), which is a holder of a financial adviser’s licence under the Financial Advisers Act, Chapter 110 in Singapore.
By receiving or reading this report, you agree to be bound by the terms and limitations set out below. Any failure to comply with these terms and limitations may constitute a violation of law. This report has been provided to you for personal use only and shall not be reproduced, distributed or published by you in whole or in part, for any purpose. If you have received this report by mistake, please delete or destroy it, and notify the sender immediately.
The information and any analysis, forecasts, projections, expectations and opinions (collectively, the “Research”) contained in this report has been obtained from public sources which Phillip Securities Research believes to be reliable. However, Phillip Securities Research does not make any representation or warranty, express or implied that such information or Research is accurate, complete or appropriate or should be relied upon as such. Any such information or Research contained in this report is subject to change, and Phillip Securities Research shall not have any responsibility to maintain or update the information or Research made available or to supply any corrections, updates or releases in connection therewith.
Any opinions, forecasts, assumptions, estimates, valuations and prices contained in this report are as of the date indicated and are subject to change at any time without prior notice. Past performance of any product referred to in this report is not indicative of future results.
This report does not constitute, and should not be used as a substitute for, tax, legal or investment advice. This report should not be relied upon exclusively or as authoritative, without further being subject to the recipient’s own independent verification and exercise of judgment. The fact that this report has been made available constitutes neither a recommendation to enter into a particular transaction, nor a representation that any product described in this report is suitable or appropriate for the recipient. Recipients should be aware that many of the products, which may be described in this report involve significant risks and may not be suitable for all investors, and that any decision to enter into transactions involving such products should not be made, unless all such risks are understood and an independent determination has been made that such transactions would be appropriate. Any discussion of the risks contained herein with respect to any product should not be considered to be a disclosure of all risks or a complete discussion of such risks.
Nothing in this report shall be construed to be an offer or solicitation for the purchase or sale of any product. Any decision to purchase any product mentioned in this report should take into account existing public information, including any registered prospectus in respect of such product.
Phillip Securities Research, or persons associated with or connected to Phillip Securities Research, including but not limited to its officers, directors, employees or persons involved in the issuance of this report, may provide an array of financial services to a large number of corporations in Singapore and worldwide, including but not limited to commercial / investment banking activities (including sponsorship, financial advisory or underwriting activities), brokerage or securities trading activities. Phillip Securities Research, or persons associated with or connected to Phillip Securities Research, including but not limited to its officers, directors, employees or persons involved in the issuance of this report, may have participated in or invested in transactions with the issuer(s) of the securities mentioned in this report, and may have performed services for or solicited business from such issuers. Additionally, Phillip Securities Research, or persons associated with or connected to Phillip Securities Research, including but not limited to its officers, directors, employees or persons involved in the issuance of this report, may have provided advice or investment services to such companies and investments or related investments, as may be mentioned in this report.
Phillip Securities Research or persons associated with or connected to Phillip Securities Research, including but not limited to its officers, directors, employees or persons involved in the issuance of this report may, from time to time maintain a long or short position in securities referred to herein, or in related futures or options, purchase or sell, make a market in, or engage in any other transaction involving such securities, and earn brokerage or other compensation in respect of the foregoing. Investments will be denominated in various currencies including US dollars and Euro and thus will be subject to any fluctuation in exchange rates between US dollars and Euro or foreign currencies and the currency of your own jurisdiction. Such fluctuations may have an adverse effect on the value, price or income return of the investment.
To the extent permitted by law, Phillip Securities Research, or persons associated with or connected to Phillip Securities Research, including but not limited to its officers, directors, employees or persons involved in the issuance of this report, may at any time engage in any of the above activities as set out above or otherwise hold an interest, whether material or not, in respect of companies and investments or related investments, which may be mentioned in this report. Accordingly, information may be available to Phillip Securities Research, or persons associated with or connected to Phillip Securities Research, including but not limited to its officers, directors, employees or persons involved in the issuance of this report, which is not reflected in this report, and Phillip Securities Research, or persons associated with or connected to Phillip Securities Research, including but not limited to its officers, directors, employees or persons involved in the issuance of this report, may, to the extent permitted by law, have acted upon or used the information prior to or immediately following its publication. Phillip Securities Research, or persons associated with or connected to Phillip Securities Research, including but not limited its officers, directors, employees or persons involved in the issuance of this report, may have issued other material that is inconsistent with, or reach different conclusions from, the contents of this report.
The information, tools and material presented herein are not directed, intended for distribution to or use by, any person or entity in any jurisdiction or country where such distribution, publication, availability or use would be contrary to the applicable law or regulation or which would subject Phillip Securities Research to any registration or licensing or other requirement, or penalty for contravention of such requirements within such jurisdiction.
This report is intended for general circulation only and does not take into account the specific investment objectives, financial situation or particular needs of any particular person. The products mentioned in this report may not be suitable for all investors and a person receiving or reading this report should seek advice from a professional and financial adviser regarding the legal, business, financial, tax and other aspects including the suitability of such products, taking into account the specific investment objectives, financial situation or particular needs of that person, before making a commitment to invest in any of such products.
This report is not intended for distribution, publication to or use by any person in any jurisdiction outside of Singapore or any other jurisdiction as Phillip Securities Research may determine in its absolute discretion.
IMPORTANT DISCLOSURES FOR INCLUDED RESEARCH ANALYSES OR REPORTS OF FOREIGN RESEARCH HOUSE
Where the report contains research analyses or reports from a foreign research house, please note:

Richard covers the Transport Sector and Industrial REITs. He graduated with a Master of Science in Applied Finance from the Singapore Management University. He holds the CFTe and FRM certifications and is a CFA charterholder.
He was ranked #2 Top Stock Picker (Asia) for Real Estate Investment Trusts in the 2018 Thomson Reuters Analyst Awards, and ranked #2 Top Stock Picker (Singapore) for Resources & Infrastructure in the 2016 Thomson Reuters Analyst Awards.
